The Extra Point
Welcome to the Extra Point, where members of the NFL's football data and analytics team will share updates on league-wide trends in football data, interesting visualizations that showcase innovative ways to use the league's data, and provide an inside look at how the NFL uses data-driven insight to improve and monitor player and team performance.
What Stats Suggest About the NFL’s New Kickoff
April 3, 2024
How Player Performance and Team Efficiency Are Affected by Each Tick on the Play Clock
January 3, 2024
How NFL Stadiums Factor in Dropped Passes
November 29, 2023
Where Have All the Points Gone?
November 16, 2023
What We Learned About Quarterback Push Sneaks During the 2022 NFL Season
April 25, 2023
How Luck Plays a Role in the Success of NFL Teams
November 10, 2022
The Evolution of Personnel Groupings and Usage: What is Versatility?
October 19, 2022
The Evolution of Personnel Groupings and Usage
October 7, 2022
Where have all of the NFL points gone?
September 27, 2022
With NFL kickers better than ever before, why are kickoffs shorter?
August 23, 2022
Using data and analytics to evaluate the 2022 club proposals on overtime in the postseason
March 30, 2022
Does Home Town Factor in Free Agency Decisions?
March 17, 2022
How NFL teams use the game clock – and what it says about late-game strategy
December 16, 2021
Which NFL teams mix up defensive coverages the most week-to-week
December 2, 2021
What it takes to evaluate the NFL’s future stars
November 11, 2021
How do NFL coaches use their timeouts?
November 10, 2021
Can Next Gen Stats Help Predict Pass Plays?
October 21, 2021
What record will be good enough to make this year’s NFL playoffs?
September 29, 2021
Assessing the Change in Draft Pick Value Across Positions
April 26, 2021
What data and analytics told us about 2021 Offseason NFL rules proposals
April 2, 2021
What does the NFL’s home-field advantage look like in 2020?
January 5, 2021
Analyzing Defensive Pass Interference Fouls in the NFL and NCAA
November 20, 2020
Comparing Kickers Across the League on Accuracy Between the Uprights
October 22, 2020
Evaluating Subtle Differences in NFL QB Release Points
October 1, 2020
Tom Brady — Master of the QB Sneak
September 24, 2020
Rookies on Week 1 Rosters
September 17, 2020
Field Goal Success Probabilities by Direction
July 16, 2020
Going for it on Fourth Down Becoming the New Norm for NFL Coaches
April 21, 2020
Probability models for the new 14-team playoff system
April 6, 2020
Big Data Bowl Winning Paper Leads to New Drill at the NFL Combine
March 4, 2020
2020 Big Data Bowl Recap
February 27, 2020
What the Top Predictions Looked Like in the NFL's Big Data Bowl
January 27, 2020
Why Fourth-and-15 from the 25? Insight into the NFL’s experiment with an onside-kick alternative
January 24, 2020
Punters in 2019 Were Performing Better Than Ever
January 17, 2020
More Girls are Playing Tackle Football
January 9, 2020
The Biggest NFL Comebacks of the Last Decade
December 31, 2019
When are teams being more aggressive on fourth down?
December 24, 2019
Teams Taking More Time Off Play Clock in 10-minute OTs
December 19, 2019
Win Probability Models for Every NFL Team in 2019
December 11, 2019
Where’s the best spot on the field to complete passes… and not get picked off?
December 5, 2019
Frank Gore Keeps on Running
November 27, 2019
Aaron Rodgers Takes Advantage of Free Plays Better Than Anyone
November 21, 2019
How Do NFL Coaches Use Their Challenges?
November 14, 2019
Visualizing the Special Teams Gunner
October 29, 2019
What Numbers Tell Us About Preseason Play Time
October 23, 2019
Where Do Ball Carriers Tend to Move?
October 15, 2019
A Conversation with Two Big Data Bowl Finalists
October 10, 2019
What Can Player Tracking Data Tell Us About the Onside Kick?
October 2, 2019
Q&A with 2019 Big Data Bowl College Winners
September 25, 2019
Where Your Favorite Team Likes to Pass the Ball
September 23, 2019
Using Data and Analytics to Identify High-Impact Fouls
September 23, 2019
What Stats Suggest About the NFL’s New Kickoff
April 3, 2024
The NFL kickoff has evolved in several ways over the past 30 years. Ahead of the 2024 season, NFL clubs have approved major changes to the kickoff rule to increase the return rate and reduce player speed and high-speed collisions.
Here’s a video explaining the new format:
The NFL Football Operations data and analytics team has spent the offseason analyzing the potential impact of the rule. Some of the analysis was pulled from XFL data and its similar kickoff format.
Here are a few things to expect during the 2024 season:
- More returns. With kickers encouraged to kick the ball into the landing zone — between the goal line and 20-yard line — special teams coaches estimate that between 50–60% of kickoffs will be returned. This compares to a record-low 22% of kickoffs that were returned during the 2023 season.
- Better field position for the return team. The average XFL field position on returns was the 29.1-yard line, varying based on several factors outlined in the chart below. As a result, NFL drives are expected to start closer to the 30-yard line, out from the 25-yard line under the old rule.
- Uncertainty. In 2023, 88% of drives after kickoffs started between the 21–30-yard lines. In the new format, variability is expected on both sides of that interval. During the 2023 XFL season, 30% of drives started on or beyond the 31-yard line, and 17% of drives started inside the 20-yard line.
A new strategy is also expected to infiltrate the play — where the kicker should aim his kick.
This chart outlines the field position for the return team on kickoff returns. The locations where kickoffs land are categorized into five groups:
- 16–20-yard line
- 11–15-yard line
- 6–10-yard line
- 1–5-yard line
- Kicks returned that landed in the end zone
The text on the right gives the average and median field position, along with the percent of time that starting field position is inside the 30-yard line within each category. The 30-yard line is a critical marker for both teams, since that’s where the ball would be placed on kicks that land in the end zone.

The deeper the ball is kicked, the worse field position for the receiving team. Kickoffs returned after landing in the end zone had a median starting field position at the 23-yard line. Returns originating further out from the end zone provided better starting field positions. For example, kicks landing between the 16–20-yard lines had a median starting field position at the 29-yard line.
In most yard-line groups, the average field position is greater than the median. However, this average is skewed by some long kickoff returns. Kickoffs landing between the 1–5-yard lines had a median starting field position at the 26-yard line, but six kickoff returns past midfield skewed the average, bumping it out to the 28.7-yard line.
Why does this matter? When the return team is debating whether to return a kick landing near its end zone, the choice might be impacted by average starting field position, which is more friendly to the return team than the median field position.
Finally, kickers can’t kick the ball too deep. The resulting touchback for kicks in the end zone is the 30-yard line, versus the 25-yard line in 2023.
With the incentives of the new kickoff and this data, kickers are expected to aim their kicks towards the back of the landing zone and force a return. Ideally for the kicking team, this results in tackling the returner short of the 30-yard line.
How Player Performance and Team Efficiency Are Affected by Each Tick on the Play Clock
January 3, 2024
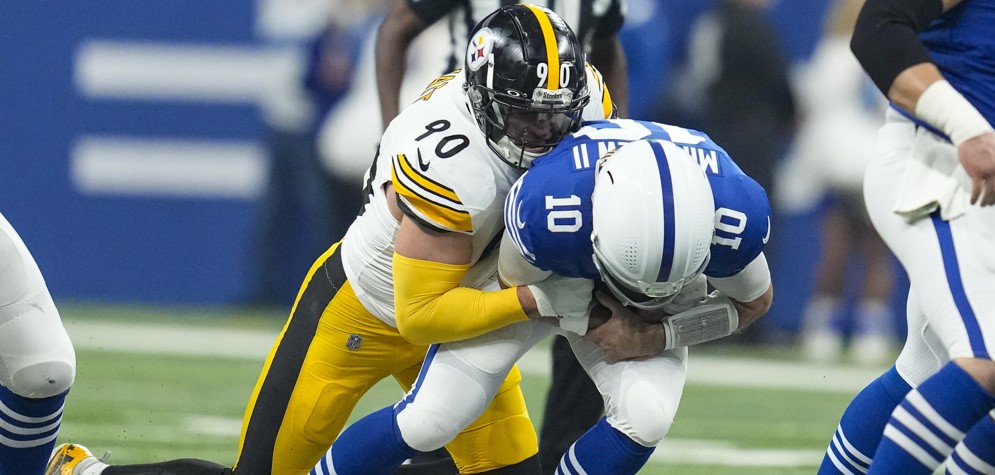
During the NFL’s Week 15 game between the Pittsburgh Steelers and Indianapolis Colts, Steelers linebacker T.J. Watt timed his pass rush perfectly to sack Colts QB Gardner Minshew.
In the clip below, Watt is nearly across the line of scrimmage before anyone else has moved.
One potential reason for Watt’s anticipation? The play clock, which ticked down to only one second at the time of the snap. With such little time left, Watt seemed to time the snap and gain an edge on the Colts’ offensive line.
This skill is not unique to Watt – using Next Gen Stats tracking data, defensive ends typically reach speeds that are 10% faster with one second left (16 MPH) on the play clock, relative to 10 seconds left (14 MPH).
More importantly, that impact of the play clock extends to the entire offensive side of the ball.
The graph below shows the expected points added (EPA) per play from 2016-23 by quarter, play type (run or pass), and time remaining on the play clock. The size of the dots represents the relative sample size for a given play clock snap time.

In the first quarter, there is a dramatic drop in EPA as the play clock ticks for passing plays – roughly a 0.015 EPA per play decrease for each second on the play clock. This trend represents an overall delta of approximately 0.2 EPA per play from 15 seconds on the play clock to one second. For reference, a difference of 0.2 EPA per play is similar to the difference between the second-highest EPA per pass team of 2023 (Dallas Cowboys) and the 19th-highest EPA per pass team of the 2023 season (Indianapolis Colts).
A drop in offensive efficiency also exists in the second (-0.009 EPA per play clock second) and third quarters (-0.008 EPA per play clock second). By the fourth quarter, however, when play clock snap time typically ties to score and time remaining, the relationship is not as strong (-0.004 EPA per play clock second).
There is no noticeable link between running play performance and play clock time.
Outside of the ability of defensive players to anticipate snap counts late in the play clock, there are a few other explanations for the drop in offensive performance. For example, quarterbacks less prepared to face specific defensive looks may take longer on the play clock as they change their protection or play call. In the first quarter, offenses typically “script” plays – anything off script may result in more time on the play clock and worsen performance.
This decline in performance appears to exist for most teams. Since 2016, for 71% of team seasons (182 of 256), the average EPA on passes were lower on plays snapped with five or less seconds on the play clock, relative to those snapped with 10 or more seconds. This season, the Seattle Seahawks have a 0.06 EPA per play when the ball is snapped with 10 or more seconds, but -0.39 EPA per play when the ball is snapped with five or less seconds.
How NFL Stadiums Factor in Dropped Passes
November 29, 2023
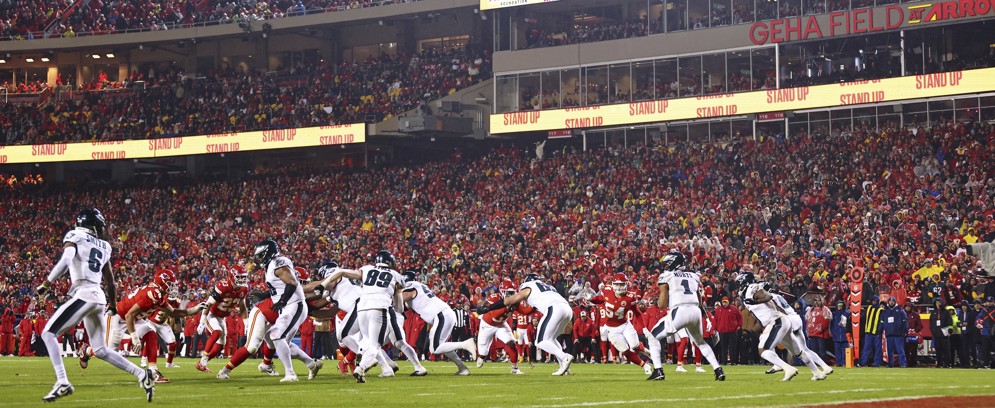
After Kansas City Chiefs wide receiver Marquez Valdes-Scantling dropped a possible game-changing touchdown pass at home against the Philadelphia Eagles on Monday Night Football, Miami Dolphins wide receiver (and ex-Chief) Tyreek Hill tweeted the following:
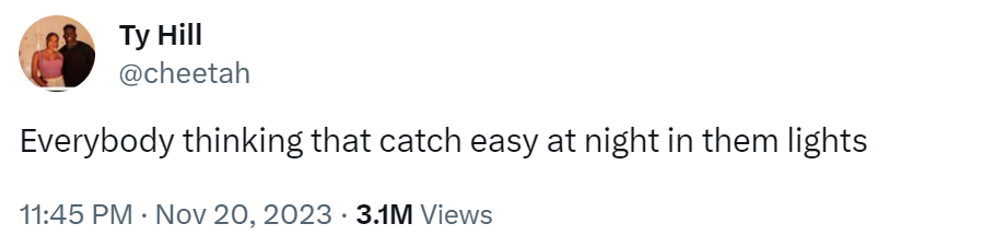
Hill knows about catching balls in Kansas City as well as anyone, as he has the second-most targets at Arrowhead Stadium from 2016 to present (342 total).
So, does he have a point about the lights?
Using PFF data, we looked at the rates of dropped passes in each team’s home stadium during Week 12 games from 2016-23, filtering for current stadiums only and splitting by start time to account for potential differences during the day and night hours.
In the chart below, each dot represents a drop rate — the percent of catchable balls that are labeled as drops — using stadium/start times with at least 150 catchable pass attempts since 2016. The dotted vertical line in the middle reflects the league average drop rate of 6.7%.

Kansas City’s home stadium (currently GEHA Field at Arrowhead Stadium) is the only one (out of 30) that boasts a statistically higher drop rate at night than during other game times. The 10.3% of catchable passes dropped in Kansas City at night is the highest of any stadium/start time combination. And the drop rates in Kansas City at 1 p.m. (6.5%) and 4 p.m. (6.7%) are in line with the league average.
The high drop rate at Arrowhead is also exacerbated for Hill, who dropped 13 of 89 (14.6%) catchable balls at night, far above his rates at 1 p.m. (1.7%) and 4 p.m. (4.1%). Away from Kansas City, Hill has only dropped four of 102 catchable balls at night (3.9%).
Only one other stadium showed a significantly different drop rate by start time. Baltimore’s M&T Bank Stadium had a significantly lower drop rate at night (4.5%, compared to 7.1% at 1 p.m. and 9.3% at 4 p.m.).
As an additional comparison, the 10 stadiums with the highest drop rates are all outdoors, and nine of the 10 with the lowest drop rates are domes or warm-weather teams, excluding Cincinnati. What’s more, the drop rate at the outdoor MetLife Stadium in New Jersey (8.1%) is roughly 1.8 times higher than Minnesota’s domed U.S. Bank Stadium (4.6%).
Contributed by: Tom Bliss and Michael Lopez
Where Have All the Points Gone?
November 16, 2023
Through Week 10 of the 2023 NFL season, scoring has been at its lowest in over a decade with several dominant defenses and few high-scoring offenses.
What has changed this season? Here is a mid-year look at the 2023 NFL season
Scoring
The following table shows key scoring-related metrics through Week 10. The color of each cell corresponds to the relative rank (since 2003) of the 2023 season.

While first-half scoring has been close to the median across the last 20 seasons, third- and fourth-quarter scoring are closer to the bottom. For example, 12.0 points scored per fourth quarter is the lowest in the league since 2005. Drives per game are also low, meaning teams have fewer opportunities to convert a possession into a score.
While 3rd/4th-and-short success is in line with previous years, 3rd/4th-and-medium/long success have been historically low this season. The 2023 season is the first in 20+ years of play where the 3rd/4th-and-long (seven yards or more) conversion rate was less than 40%.
Quarterback Play
The second table focuses on quarterback play.

This season has featured 48 starting QBs, the sixth-most through Week 10. Sacks, scrambles, and average time to throw are all high, meaning QBs are holding on to the ball longer and either taking a sack or leaving the pocket.
While pass attempts over 20 yards have decreased to only 8.8 per game, passes that are behind the line of scrimmage have increased to 16.1 per game. With fewer deep passes, interceptions per game have decreased to 0.8 per game.
Other Metrics of Interest:
- NFL punting is the strongest it has been since at least 2003 (likely in NFL history) with 41.8 net yards per punt.
- Defensive pre-snap fouls per game is third lowest in the last 20 years with 1.6 per game.
- Onside kick recovery rate remains low (5.6%): This recovery rate follows in line with recent seasons under the 2018 kickoff alignment (13.5% recovery rate before 2018).
Overall, the average 2023 NFL game has been more conservative than previous years with fewer deep pass attempts and fewer frequent, longer drives.
Will the second half of the 2023 NFL season look different?
Contributed by: Tom Bliss and Michael Lopez
What We Learned About Quarterback Push Sneaks During the 2022 NFL Season
April 25, 2023
From 2017 through the 2022 NFL regular season, the rate of all quarterback sneaks increased by nearly three times (0.39 per game to 1.08). During the 2022 season, there was a dramatic uptick in “push sneaks” where players lined up behind/offset to the QB in a sneak formation and immediately pushed the back of the QB (indirect pushes are less clear). This contrasts with the “traditional” sneak, where the QB is not intentionally pushed from behind.
To better understand and define the impact of push sneaks, the NFL reviewed sneaks of all kinds using film from the 2017 through 2022 seasons. For a play to be considered a sneak, the QB must receive an under-center snap and immediately move forward once possession has been established.
Here is the information collected for each play:
Here is the information collected for each play:
- What kind of sneak was it?
- Traditional: QB was not intentionally assisted by a player on the offense
- Direct Push: QB was intentionally, immediately, and directly assisted by a player on the offense (non-OL)
- Indirect Push: QB was likely intentionally but not immediately assisted by a player on the offense (non-OL)
- Who performed the push?
- Was the play successful? Defined by gaining one or more yards from the team’s own goal line, gaining 40% of needed yards on first down, 60% of needed yards on second down or 100% of needed yards on third or fourth down.

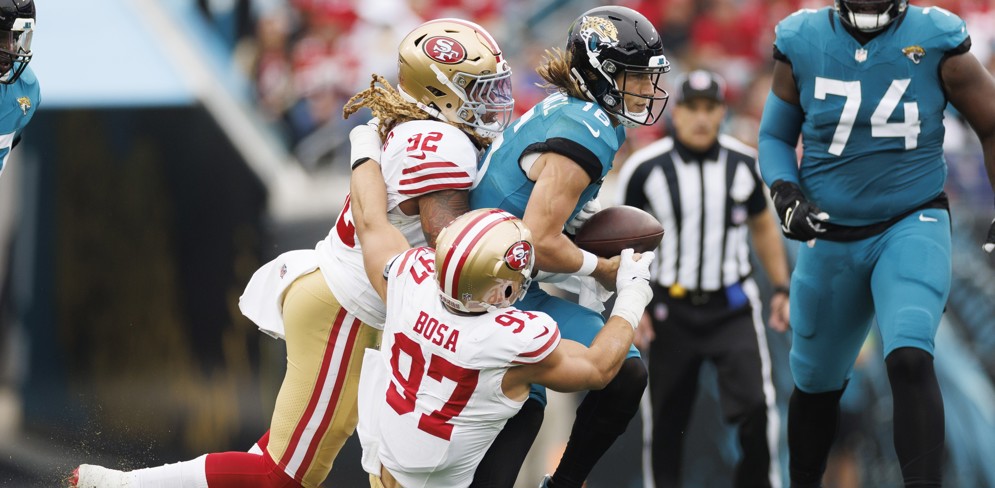
Traditional
Figure 1: Two examples of traditional sneaks.

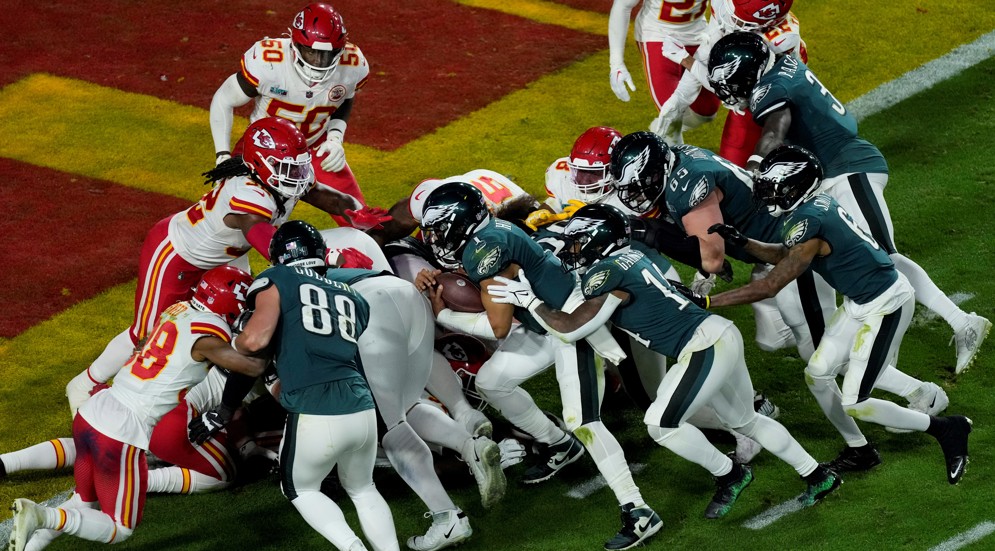
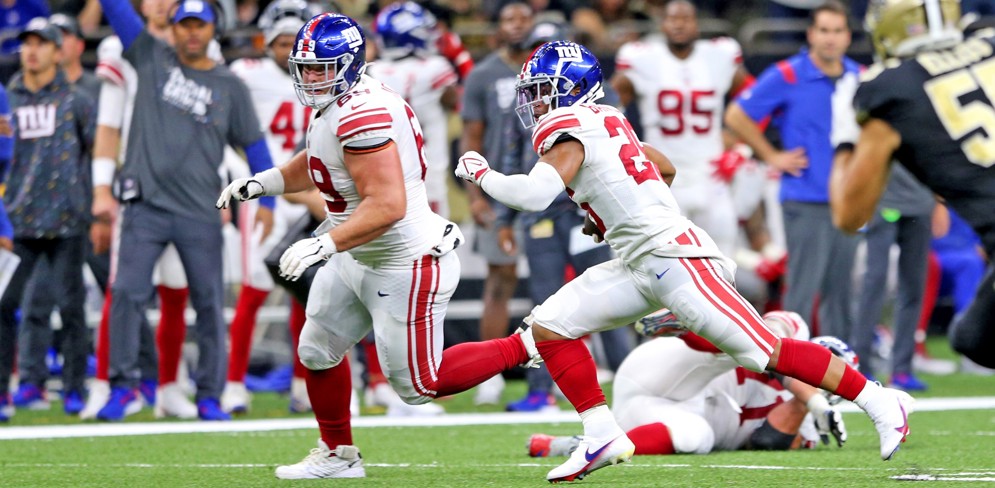
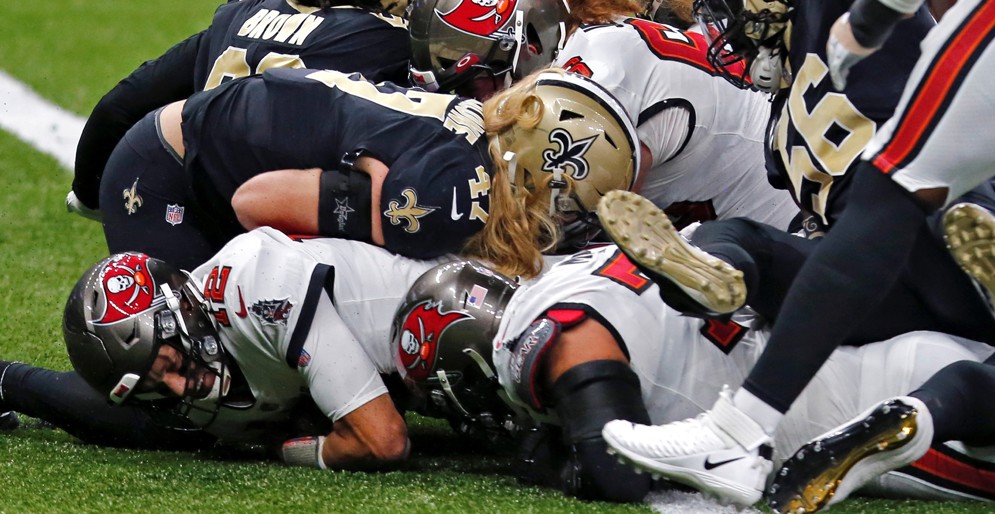
Push Sneak
Figure 2: Two examples of push sneaks. LEFT: Derek Carr (QB #4) is pushed by Alec Ingold (#45), RIGHT: Jalen Hurts (QB #1) is pushed by Miles Sanders (RB #26) and A.J. Brown (WR #11).
Philadelphia Eagles at Arizona Cardinals | 2022 Regular Season - Week 5
Jalen Hurts (QB #1) is pushed by Miles Sanders (RB #26) from a variation of the Maryland I Formation.
Tampa Bay Buccaneers at Miami Dolphins | 2017 Regular Season - Week 11
Ryan Fitzpatrick (QB #14) is pushed by Doug Martin (RB #22), Chris Godwin (WR #12), and Cameron Brate (TE #84) from a variation on “victory formation”.

Table 1 provides a summary comparing the success rate of push sneaks versus traditional sneaks, based on the line of scrimmage.
Overall, success rates were similar for both push and traditional sneaks, with push sneaks slightly more effective from near the offense’s own goal line. However, success rates are not consistent for all with high push sneak rate teams (Buffalo Bills, Cleveland Browns, Dallas Cowboys, Indianapolis Colts, and Philadelphia Eagles) ahead of the pack in terms of efficiency on both traditional and push sneaks.
In terms of the players doing the pushing, approximately 45% of all pushers were running backs, 25% tight ends, 15% wide receivers and 11% fullbacks (up to three players on any given play can be considered a pusher). Miles Sanders was the leader with 18 “push assists” over the study period.
The majority of sneaks not from the offense’s own goal line occurred on third/fourth down or the opponent’s goal line. Additionally, on plays where the QB jumps over the line of scrimmage (in all areas of the field), the success rate is 79%.
In summary, the NFL reviewed video and Next Gen Stats of thousands of plays to check for the presence and type of QB sneaks. While push sneaks have increased in frequency over the last two years, they do not appear to be more effective than traditional sneaks at gaining the offense a first down.
Note: Due to the amount of manual film review required and no clear definition for a push sneak, the numbers reported might vary slightly from those presented elsewhere publicly, such as those in Kalyn Kahler’s series of articles on The Athletic.
Contributed by: Juliana Bushnell, Ananya Singh, Andrew Patton, and Michael Lopez
How Luck Plays a Role in the Success of NFL Teams
November 10, 2022
At the end of last season’s Baltimore Ravens at Detroit Lions Week 3 game, Ravens kicker Justin Tucker nailed a 66-yard game winning field goal as time expired. Had Tucker missed – which according to the Next Gen Stats team, he had a 90% chance of doing – the game would have ended with a Lions victory. So, Tucker’s near-impossible kick cost the Lions 90% in expected win probability (or 0.90 wins).
Although NFL game outcomes are far from random, teams still get lucky. We identified four key scenarios where teams benefit from actions in a game that are almost entirely derived from opponent performance or lucky bounces.
- Dropped Interception (dropped by opponent): When an opponent drops an interception, you get lucky. We assume that the intercepting team keeps possession at the spot of the drop.
- Dropped Pass (dropped by opponent): When an opponent drops a pass, you get lucky. We assume the offense would gain yards after catch using the Next Gen Stats Expected YAC model.
- Field Goals and Extra Points (attempted by opponent): When an opponent misses a kick, you get lucky, and when your opponent makes a kick, you get unlucky. Field goal make probabilities are based on the Next Gen Stats Field Goal Probability model.
- Fumble Recoveries (by either team): When a team recovers a fumble, there’s a chance the luck of the bounce was involved. Fumble recovery probabilities are based on observed recovery percentages by when the fumble occurred (i.e., after a catch, during a rush, fumbled snap, muffed punt).
The chart below shows wins added by various categories of “luck” in Weeks 1-9 of the 2022 season. These values are measured by calculating the win probability of the observed outcome and subtracting the expected win probability based on the likelihood of each luck outcome. Win probability is calculated using the time remaining, point differential, down, distance, yard line and timeouts remaining. Expected wins added is calculated by summing the win probability of each outcome weighted by the chance of the outcome occurring. Thus, an opponent missing a game-winning field goal with a 90% chance of being good is measured as considerably more lucky (+0.90 wins) than an opponent missing a game-winning field goal that had a 10% chance of being good (+0.10 wins).

According to our analysis, the Pittsburgh Steelers have the highest total statistical luck in Weeks 1-9 of the 2022 season. This includes benefitting from one of the luckiest opponent field-goal outcomes of the season when the Cincinnati Bengals missed a game-winning 29-yard field goal in overtime in Week 1 (+0.58 wins), and the luckiest dropped pass of 2022 when the Bengals dropped a game-winning touchdown near the end of regulation (+0.36 wins).
On the other hand, the Carolina Panthers have benefited the least in 2022. The Panthers lost to the Cleveland Browns in Week 1 on a 58-yard game-winning field goal (-0.61 wins), and to the New York Giants in Week 2 on two field goals over 50 yards in the fourth quarter (-0.27 total wins).
It’s important to note that our estimates of luck appear to be, indeed, luck. For example, when comparing the split-season correlations of luck (i.e., a team’s luck in Weeks 1-9 versus Weeks 10-17), each of our four components of luck are uncorrelated. So, there’s nothing to suggest that over the course of the rest of the season, the Steelers will remain lucky while the Panthers remain unlucky.
Here are the highest wins added outcomes of 2022:
- Dropped Interception (dropped by opponent): Week 1 Indianapolis Colts at the Houston Texans – Texans dropped an interception up by 7 with 1:05 left on the clock (+0.31 wins).
- Dropped Pass (dropped by opponent): Week 1 Pittsburgh Steelers at the Cincinnati Bengals – Bengals dropped a pass in the endzone down 6 with :09 seconds left on the clock (+0.36 wins).
- Field Goals and Extra Points (attempted by opponent): Week 1 New York Giants at the Tennessee Titans – Titans missed a 47-yard field goal down 1 with :04 seconds remaining (+0.66 wins).
- Fumble Recoveries (by either team): Week 2 Arizona Cardinals at the Las Vegas Raiders – Raiders fumble recovered by the Cardinals and returned for a game-winning touchdown in overtime (+0.28 wins).
The Evolution of Personnel Groupings and Usage: What is Versatility?
October 19, 2022
During the 2022 NFL season, more than 60% of offensive snaps have been played with 1 RB, 1 TE, and 3 WR (“11” personnel) and nearly 65% of defensive snaps with 5 DBs (nickel). However, as we hinted in a prior article, the personnel complexities of these groupings go beyond simply counting the number of players with a certain position listed in the roster.
To better understand the evolution of roster positions, we turn to Next Gen Stats (NGS). NGS automatically assigns a play-level position to each player based on where they line up on the field, regardless of their listed roster position. For example, if a punter is lined up as a defensive end with a hand on the ground, they have a position of “edge” assigned to them for that specific play. Offense and defense have six and nine positional category assignments respectively, with each player assigned to exactly one category on a given play.
To assess how well distributed the player’s snaps are within the possible positional alignment, we calculate (using the Gini coefficient similar to Krishna Narsu’s NBA versatility), a versatility score with a higher value indicating more positional alignment versatility and a lower value less positional alignment versatility. The two tables below show the top five most positionally versatile players on offense and defense through Week 6, split by their listed roster position. Offensive linemen and quarterbacks are excluded from the analysis due to the static nature of their alignments.


One important element to note is that individual versatility is not a measure of quality in either direction. There are Hall of Famers and all-time greats who are both highly positional versatile (Charles Woodson playing cornerback, safety, and linebacker) and less versatile (Randy Moss who did not take many snaps at fullback). The versatility calculations only use snap counts, with no play level evaluation of success. While we do not have per-snap effectiveness on a player level, we do have it on a team level. Interestingly, skill position versatility is positively correlated with team offensive EPA per play (model via nflverse) as seen in Figure 3, whereas there is no linear correlation between defensive versatility and defensive EPA per play. This would be an even stronger trend if the Los Angeles Rams offense was closer to the productivity of prior seasons.

Returning to Figures 1 and 2, we can start to tease out the schematic links to why these specific players are highly versatile. Julian Love and Chuck Clark are both “do everything” safeties, with Love playing for the New York Giants’ Wink Martindale (known for being creative and aggressive), and Clark playing for the Baltimore Ravens’ Mike McDonald, a former staff member under Martindale. Moving to linebacker, Arizona Cardinals’ Isaiah Simmons and Miami Dolphins’ Jerome Baker are the top two, but with totally different positional distributions, with Simmons spending approximately a third of his time as a cornerback or slot cornerback, and Baker almost half the time working as an edge rusher or interior lineman.
On the offensive side of the ball, two Rams players, wide receivers Cooper Kupp and Ben Skowronek, lead the way in terms of offensive versatility, frequently lining up all over the field. Skowronek is noteworthy for the number of snaps he plays at fullback. For running backs and fullbacks, San Francisco 49ers’ Kyle Juszczyk and Baltimore Ravens’ Patrick Ricard are the most versatile, both playing for coaches/coordinators (Kyle Shanahan and Greg Roman, respectively) known for experimental approaches to the run game and offense in general. Interestingly, the top tight end group all spend slightly less than half their snaps in traditional tight end alignments, with the majority of the remaining snaps split between wide receiver and slot wide receiver.
In the next installment in the series on positional evolution, we will look at the positional trends in participation – what the distribution of common box stats are across position groups over time. For more on positional versatility, follow along on Twitter, where the team and Top-5 charts will be updated weekly.
Contributed by: Andrew Patton
The Evolution of Personnel Groupings and Usage
October 7, 2022
The recent Extra Point post “Where have all of the NFL points gone?” outlined how the 2022 NFL season has had the fewest points scored per game through Week 3 since 2010. The primary driver for this change is the severe reduction in passing efficiency. According to data provided by the nflverse team (Ben, Seb, Tan, Lee, and John) there was an approximately 180-point cumulative drop from Week 3 in 2021.
The main hypothesis for the decrease in aerial fireworks is the increasing prevalence of “two high” safety systems designed to take away the deep pass and force offenses to chip their way down the field. These systems were popularized by Vic Fangio during his time as the defensive coordinator of the Chicago Bears from 2015–18 and the head coach of the Denver Broncos from 2019–21 and his disciples have spread across the league. As a response to the increased potency and frequency of passing, teams play an increasing amount of nickel defense (five defensive backs) at the expense of base defense (four defensive backs). As seen in the figure below, the ratio of nickel to base has increased from close to even to now greater than 2.5x, with teams in nickel more than 65% of all defensive snaps through Week 3. While just calling a defense “nickel” doesn’t do justice to the complexities of NFL defenses, we can still use the label in terms of high-level strict personnel.

Teams have been able to replace a defensive lineman or linebacker with a defensive back because offensive teams are playing more “11” personnel sets (1 RB, 1 TE, 3 WR) at the expense of heavier formations — and pretty much everything else. Since 2010, the prevalence of three or more WR formations has increased from 55% of all offensive snaps to 65%. The trend is primarily due to the explosion of “11” personnel groupings as seen below. The most extreme example of this was when the Los Angeles Rams played 100% of their offensive snaps in "11” personnel in their Super Bowl LVI victory.

However, and this is the fun part, the traditional roster position listed on the roster used to determine personnel groupings does not always align with how a player is actually used. The Rams have used WR Ben Skowronek in a traditional I-form fullback, including 19 (effective) snaps in their Week 2 31-27 win against the Atlanta Falcons.
This example merely scratches the surface on the personnel trends over the last decade. We will explore this concept in upcoming posts. Our next installment will dive into league-wide trends in positional versatility on both sides of the ball.
Contributed by Andrew Patton
Where have all of the NFL points gone?
September 27, 2022
Through the first three weeks of the 2022 NFL season, the league has seen historic comebacks, two surprise undefeated teams and more tight games than ever before.
Despite the excitement, this season's games are averaging only 42.1 points per game, a 5.0 points-per-game drop over the first three weeks of the 2021 season and lower than any season since 2010.
Where did all the points go?
The following chart shows net points added by play type using two sources — nflverse and TruMedia — and comparing 2022 to the previous ten seasons. The net points chart shows the relative change in a game’s point total due to five play types — runs, passes, extra points, field goals, and penalties — using games through Week 3.

The drop in total points in 2022 can be primarily attributed to changes in the passing game. In each of the graphs, the blue line representing pass plays plummets from 2021 to 2022. By TruMedia’s net points, this season's pass plays have been less efficient than in any of the previous 10 seasons, yielding roughly 206 points fewer than the 2011-21 average (nflverse shows about 180 fewer points on pass plays).
However, despite the drop in passing game efficiency in 2022, run game efficiency has increased. While running plays typically are associated with less scoring for several reasons, (teams running the ball to drain the clock) overall net efficiency on run plays this season is approaching that of passing the ball.
Unlike the pass and run games, the overall effect of penalties, extra points and field goals in 2022 is in line with recent seasons.
Going beyond play type, what else has changed? Here are a few additional metrics we explored:
Overall pass effectiveness
- Teams are passing with relatively similar frequency to the last few seasons — 63.3% of plays are pass plays.
- Via PFF, the rate of catchable balls is 63.8% in 2022, a five-year low. Last season through Week 3, 65.8% of balls were catchable.
- The rate of dropped passes is in line with similar seasons.
- Sack rate, time to throw, and time to pressure are similar in 2022.
- Teams are combining for 462 yards passing per game — the second-lowest total since 2012 and 28 yards per game fewer than in 2021
Defensive strategy
- NFL Teams are employing coverages with different frequency in 2022, including putting less emphasis on man schemes. Rates of Cover-1 man have dropped to 19.8% from a four-year average of 26.5%. Schemes with multiple deep safeties have jumped, including Cover-2 zone (up to 13.8% usage in 2022 from a four-year average of 11.2%) and Quarters (up to 14.7% usage in 2022 from a four-year average of 11.4%).
- Defenses are running Cover-0 with no deep safeties at a slightly higher frequency of 3.7% of plays, versus four-year average of 2.7%. And they’re doing it more effectively — the average expected points added per play against Cover-0 is -0.21 in 2022, about 0.40 points per play — and 80 net points added per season — lower than the four-year average. Cover-0 is a high-risk, high-reward style of play that has been worth the risk for defenses so far in 2022.
- Defenses have blitzed on 38.5% of plays in 2022, a big jump over the average of 27.4% over the previous four seasons.
Anecdotally, teams have also lost 11 red zone fumbles through Week 3, tied for the second most since 2011. The per-play rate of fumbles near the goal line is its highest rate since 2011.
With NFL kickers better than ever before, why are kickoffs shorter?
August 23, 2022
NFL kickers and punters have slowly improved for decades, resulting in more accurate field goal kicking, lower touchback rates on punts, and rules changes that impacted both place-kicking and kickoffs.
Kickoffs have seen the most dramatic results, with touchbacks going from a 41% touchback rate in 2011 to 61% in 2020.
Despite the trend in kicker improvement, in 2021, following two consecutive years of record highs, the rate of touchbacks on kickoffs dropped to 57%. With kickers more skillful than ever before, what changed?
The stats show that NFL kickers purposefully kicked it shorter in 2021.
The map below compares the location of kickoff landing spots in 2021 relative to the three previous seasons (2018-20). The blue areas correspond with higher landing rates in 2021 (largely before the goal line), while red areas (largely in the end zone) reflect lower landing rates.
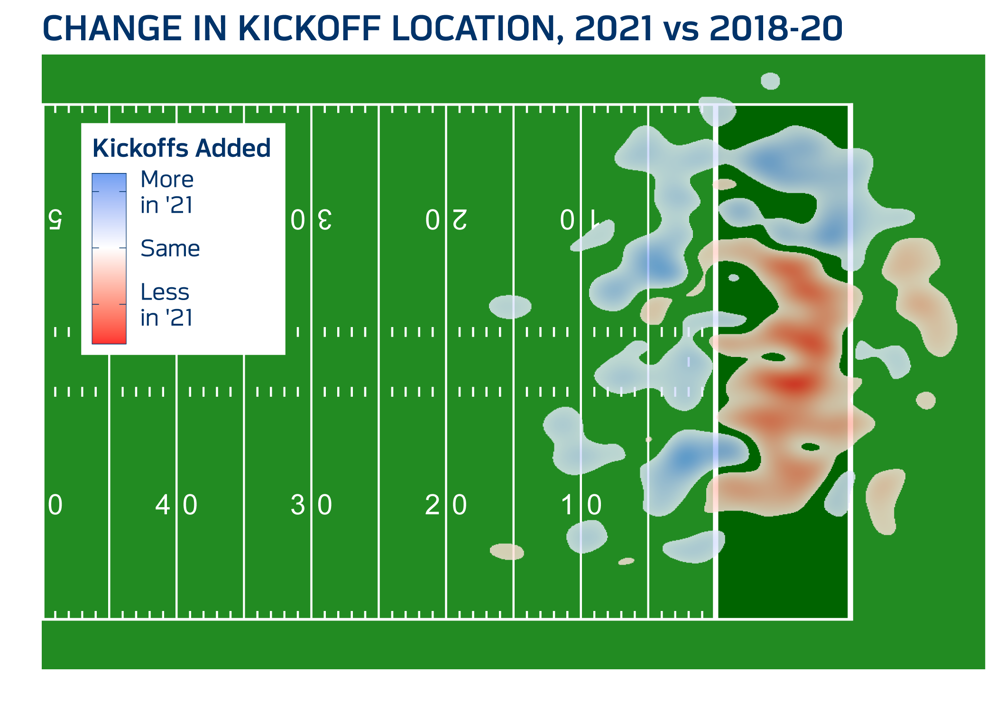
In 2021, 27.7% of kickoffs fell short of the end zone in comparison to 23.4% in 2020. Interestingly, the results were not consistent across the league, with some teams (or special teams coaches) moving in different directions.
Using kickers that remained on the same team in 2020 and 2021, the chart below shows year-over-year change in percent of short kickoffs. Each line represents a separate kicker. In blue, there are nine kickers (including the Houston Texans’ Ka’imi Fairbairn and the San Francisco 49ers’ Mitch Wishnowsky) whose short kickoff rate jumped by at least 10% from 2020 to 2021. In red, there’s one kicker (the Detroit Lions’ Jack Fox) who saw a corresponding decrease in short kickoff rates.

The increase in short kickoffs, with a noticeable between-kicker deviance in behavior, suggests teams are purposefully kicking short. In doing so, kickoff teams are forcing the return team to actually return the ball. So, why would they do that?
Despite the ball going a shorter distance, kickoffs landing between the 1-5 yard line result in worse field position for the receiving team (average field position is the 24-yard line) than kickoffs landing inside the first five yards of the end zone (average field position is the 24.7-yard line). In turn, the slight field position benefit forces teams to return the ball which is the only way of potentially forcing a turnover.
The kickoff is one example of several rules changes that have led to different on-field outcomes – some intended, some unintended. As the 2022 season kicks off, we’ll be tracking if the trend in short kickoffs continues.
Using data and analytics to evaluate the 2022 club proposals on overtime in the postseason
March 30, 2022
During the 2022 NFL Annual Meeting, NFL clubs voted to implement a new format for overtime rules in the postseason which guarantees each team a possession. This change is an amendment of a club proposal from the Indianapolis Colts and Philadelphia Eagles.
To supplement conversations on overtime, the NFL’s analytics team looked at a variety of metrics to better understand the history and direction of potential formats. Below are a few of the key takeaways.
Equity
Since overtime was implemented in 1974, the NFL has not changed its view that each team should have a fair shot at winning. However, over the last decade, a few subtle changes have made it easier for the team that receives the ball at the start of overtime.
In 2016, the NFL moved the touchback line on kickoffs from the 20- to the 25-yard line. This not only made touchdowns on the opening drives more likely, but also pushed the kickoff team farther back if it were to make a stop. Second, offenses are scoring more. This year’s total of 46.0 points per game was the fourth highest in league history. Lastly, teams are now more aggressive on fourth down than they have ever been. In 2021, teams went for it more on fourth-and-short than in any other year in the modern NFL era.
As a result of these changes, the importance of winning the coin toss and receiving the ball has also trended higher. Using the regular season overtime rules, our best Win-Loss-Tie estimate for a team receiving the ball is 54-39-7. That’s around 15% more likely that the team receiving the ball will win than it will lose. Although the estimate is an average across all teams, for teams with top offensive units, receiving the ball is even more beneficial. For example, in the 2021 Divisional Round game between the Buffalo Bills and Kansas City Chiefs, we estimate that the benefit of winning the coin toss was a swing of 25 win percentage points.
What does a guaranteed second possession do?
It secures a benefit – known as the second mover advantage – for the team that starts overtime by kicking off. Teams kicking off to start overtime will always know what is needed to either extend overtime or win the game when they get the ball back.
While the second mover advantage swings the coin toss benefit closer to 50-50, one key advantage remains for the team that receives the ball first. If the opening two drives of overtime end tied, the team that received the ball first gets the ball again in a sudden-death setting. For example, from 2017-21, the team receiving the ball first in overtime averaged 1.6 possessions per overtime session, compared to 1.1 for the team kicking off. As a result, teams receiving the ball to begin overtime won more games after their first possession than on their opening possession.
In a format where both teams have at least one possession, we expect the benefit of winning the coin toss to drop by more than half. In some postseason overtime games, teams may even want to kick off, though that decision could be dependent on team strength and weather conditions.
Entertainment
The last two games of the Kansas City Chiefs’ 2021 postseason, versus the Buffalo Bills and Cincinnati Bengals, had the Chiefs winning the overtime coin toss. Although, there was one key difference – the game against the Bills ended on the first possession, while the game against the Bengals had two possessions. To compare these two games, we used minute-by-minute Nielsen television ratings to highlight how during close games, TV ratings rise and peak at the end of a game, and once the game concludes, ratings drop off. From this data, we projected that an extra possession during the Chiefs versus Bills game would have likely generated at least five minutes of 50+ million viewers.
Long games
One of the concerns of adding additional possessions to overtime is the potential of games dragging on.
However, in overtime games where both teams open with a touchdown, a third possession is not expected to occur. In this setting, the team scoring a second touchdown is likely to face two options - a game deciding two-point conversion, or an extra-point attempt to force sudden death. We reached out to eight analytics staffers who advise head coaches over headsets on gameday and gave them this exact scenario. All eight confirmed that they would typically tell their coach to go for two. That type of aggressiveness could result in a game-deciding two-point conversion to end overtimes that begin with two touchdowns.
The rate of overtime occurring in NFL games, both as a percentage of games that go to overtime (5.5%) and of overall game time spent in overtime (0.5%), is lower than the NBA, NHL, and MLB.
Game quality
NFL overtimes also feature high-quality play. Compared to regulation, overtime plays have a lower rate of penalties, penalty yards, and missed calls from officials. In terms of health and safety, rates of missed-timed injuries and concussions drop by roughly a third in overtime. As the NFL considered formats that would only add time to overtime, ensuring a high standard of play was paramount.
Postseason
Teams receiving the ball in overtime in the modified sudden-death format (2010-21) were 10-2 (win percentage of 0.8%), driven by seven touchdowns on the opening drive. Although a small sample, the high number was often cited over the last month as the reason for driving change.
For more information about the updated overtime rules, visit the NFL Overtime Rules page.
Does Home Town Factor in Free Agency Decisions?
March 17, 2022
The 2022 NFL free agency window officially opened on March 16. Many players who currently are not under contract are weighing their options to decide where they should sign. There are many factors that go into a player's decision, including contract terms, coaching staffs and the potential success of a new team. Perhaps a less-frequently discussed factor: the proximity of each team to where a player grew up.
To assess whether or not players are more likely to sign near where they grew up, we looked at all free agent signings during the opening weeks of free agency from 2016 to 2021. This time period corresponds to when players tend to have the largest number of teams competing for their services. Of the 266 free agents with available birth location data, 13 (4.8%) signed with a team located close to the city in which they were born.
While that doesn’t sound like a high rate, it is substantially higher than what we’d expect due to chance. To estimate chance, we simulated free agency 10,000 times for each season by shuffling the locations where each free agent signed and calculating the distance between that city and the player’s birth city. We then compared the actual distribution to what was observed. The blue density curve below represents the 10,000 simulations, and the red line represents the observed percentage.

Overall, the observed rate with which players choose to play within 50 miles of home is larger than more than 99.9% of the simulations. Additionally, the relative rate of players signing closer to home is about 2.3 times higher than the average simulated percentage.
How NFL teams use the game clock – and what it says about late-game strategy
December 16, 2021
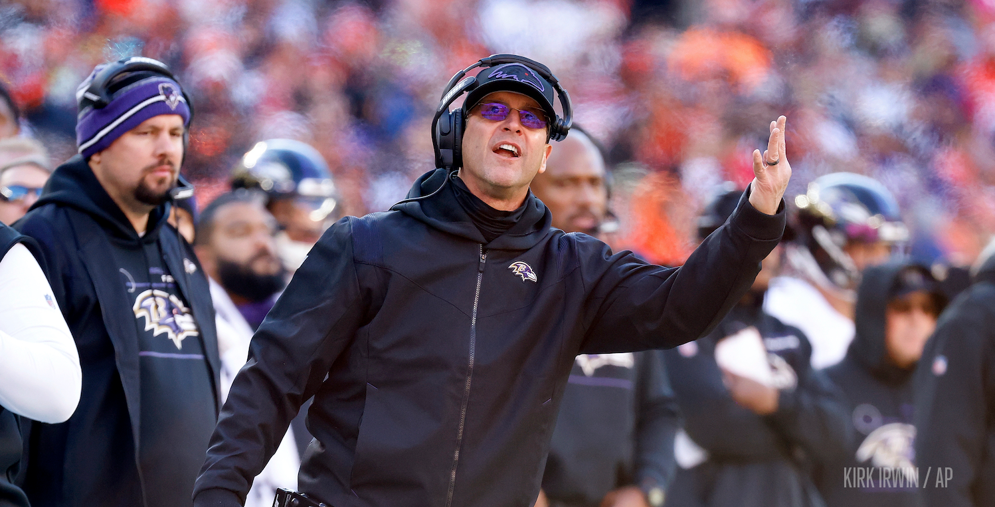
In a Week 14 matchup with the Cleveland Browns, the Baltimore Ravens scored a touchdown to cut Cleveland’s lead to nine. Ravens head coach John Harbaugh decided to attempt a two-point conversion to try and trim the lead to seven. The Ravens failed to convert and eventually lost 24-22.
Harbaugh offered an explanation for his aggressive end-of-game strategy, but not everyone supported his reasoning to go for two.
“If you’re down two scores, the other team will change their play calling, and how they direct the game,” said a skeptical Phil Simms on CBS Sports’ “Inside the NFL.” “We don’t put that into the analytics.”
To assess if the play-calling aspect of Simms’ argument was accurate, the NFL Football Operations team looked at the run vs pass rates on all first down plays from 2006-21 (using plays before a team reaches field goal range), and split by game minute and score differential in the graph below.

The blue tiles correspond to game settings based on time and score where teams run more often. The red tiles represent situations in which teams tend to pass. The yellow tiles reflect situations that call for a more balanced strategy.
There are two points in games where the strategies change based on the game situation. The first change occurs during the final two minutes of the first half. Offenses pass more, throwing the ball on around 75% of first-down plays. The second change in strategy comes near the end of the third quarter, when (as is shown in this chart) strategy starts to diverge based on both time remaining and score. Teams trailing later in games tend to throw more passes, while teams leading run more. Late in games, the difference in strategy is even more dramatic: teams trailing pass the ball close to 90% of the time on first downs; and teams with the lead run the ball at a similar rate.
To better understand the setting in the Ravens-Browns game, we focus our chart only on teams in two-possession games in the fourth quarter.
We’ve added dotted lines to show games separated by one score (1-8 points) and two scores (9 or more points).

Changes in strategy appear concentrated at each of the four horizontal lines in the graph.
As Simms suggests, teams leading by two scores run the ball 10% more often (75% vs 65%) than teams up by only one score. Teams trailing by two scores are much more likely to pass (80% vs 68%) than if they’re trailing by one score. The data shows a line of demarcation where strategy changes depending on if the score is separated by one score versus two.
But bigger leads don’t just change the probability of whether an offense calls a running play versus a passing play. There’s also an inverse link between the size of a lead and offensive success.
When compared to teams trailing by one score, defenses trailing by two scores have an easier time coming up with a stop. They give up fewer average first downs (1.1 versus 1.3), force more three-and-outs (45% versus 36%), and hold offenses to shorter drives (19.9 average net yards versus 24.8). All of that also takes less time off the clock (2:22 average time of possession versus 2:36).
Therefore, in the scenario Simms identifies that the Ravens faced, there are multiple data points that support more teams going for two. If you miss and trail by nine points, you're likely to get the ball back sooner.
Which NFL teams mix up defensive coverages the most week-to-week
December 2, 2021
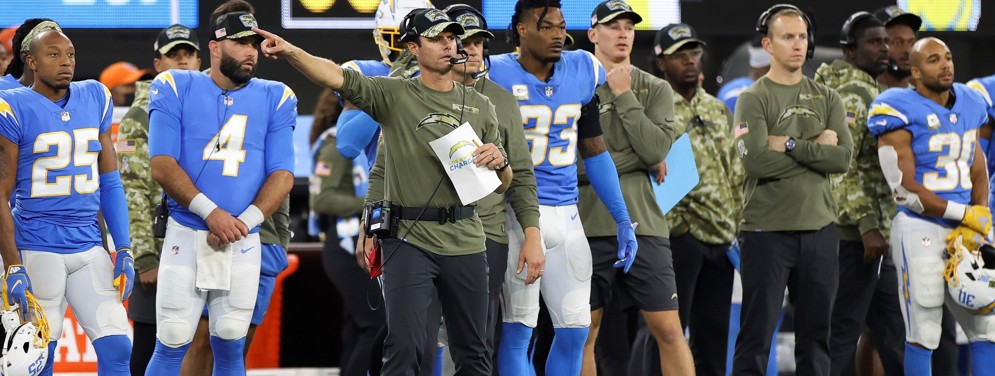
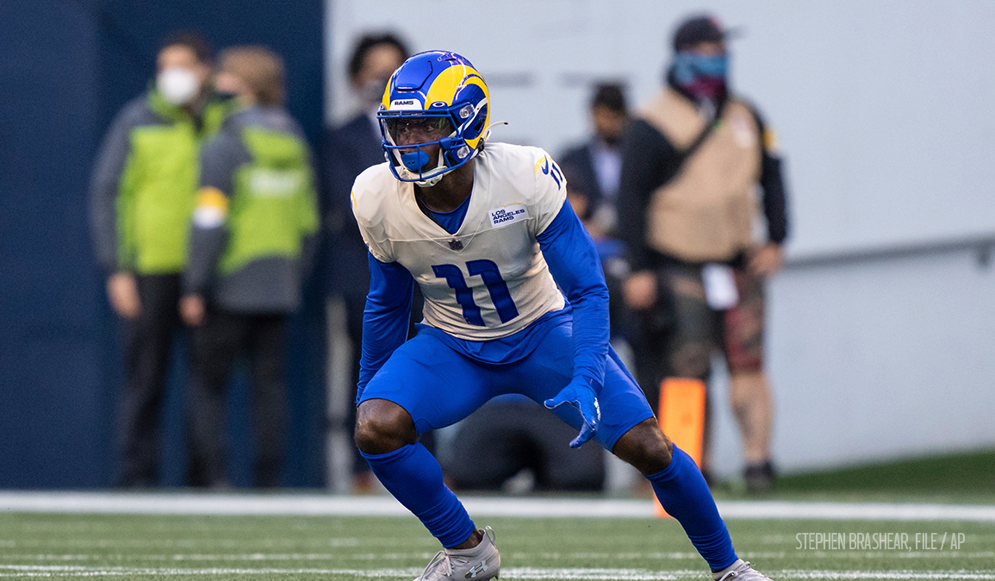
Prior to joining the Los Angeles Chargers as head coach, Brandon Staley’s defensive scheme with the Los Angeles Rams was lauded as adaptable, aggressive, and accustomed to diverse coverage schemes.
There are several reasons why a coach may mix up schemes. Among them, flexibility in scheme allows teams to surprise opponents with matchups they have not prepared for. In 2020, Staley’s Rams defense stood out for having the most unique schemes on its way to leading the NFL by allowing the fewest yards per game.
More than halfway through the 2021 season — his first as head coach — data collected confirm that Staley’s scheme has picked up right where it left off.
Using data from PFF, the chart below shows weekly distributions of coverage schemes. Teams are organized from least consistent (top left, Los Angeles Chargers) to most consistent (bottom right, New Orleans Saints), where consistency is defined by week-to-week fluctuations in coverage.
As the model of inconsistency, the Chargers ran Cover 1 Man on 70% of Week 3 plays against the Kansas City Chiefs, only to run the same coverage just 15% of the time during a Week 4 matchup against the Las Vegas Raiders.
Teams that are more consistent from week-to-week tend to stick to the same script. For example, the Saints ran a Cover 1 Man scheme between 16-39% of the time in each of their games.

In addition to weekly shifts in strategies, these anecdotes stick out from the chart above:
- Cover 0 Man is one of the riskiest strategies to deploy, as no safeties are left to help on deep routes. So far during the 2021 season, teams have run Cover 0 Man in different ways. The Miami Dolphins ran Cover 0 Man in each of its first 12 games, including 24 times against the Baltimore Ravens in Week 10. The Las Vegas Raiders have run Cover 0 Man only five plays all season.
- Eight games this season have featured a team that ran the same coverage scheme on at least 70% of defensive snaps. The Raiders’ Cover 3 Zone accounts for six of those eight games. Against the Philadelphia Eagles in Week 7, the Raiders ran Cover 3 Zone on 95% of defensive snaps.
- The New England Patriots ran a zone-based coverage scheme on about 40% of snaps from Weeks 1-6. From Week 7 onwards, they have been in zone coverage on about 70% of defensive snaps.
Coverage schemes are also relevant for measuring what defensive coordinators think about their opponent’s offenses. Some quarterbacks may be more difficult to prepare for and could force opponents to try new strategies for defending the pass.
The chart below shows what coverages each team’s offense faces.

Second-year Eagles quarterback Jalen Hurts has faced unique coverages. Teams have deployed both zone heavy (Weeks 9 and 10) and man heavy (Weeks 7, 11, and 12) approaches to slowing down the Eagles offense.
The Eagles offense has also faced the second-most Cover 0 Man defenses (65 snaps, behind the Baltimore Ravens’ 87 snaps) with Hurts and Ravens quarterback Lamar Jackson among the NFL’s most mobile signal-callers. In comparison, the Chiefs and quarterback Patrick Mahomes, a traditional pocket passer, have only seen Cover 0 Man on seven snaps, fewest in the league.
What it takes to evaluate the NFL’s future stars
November 11, 2021
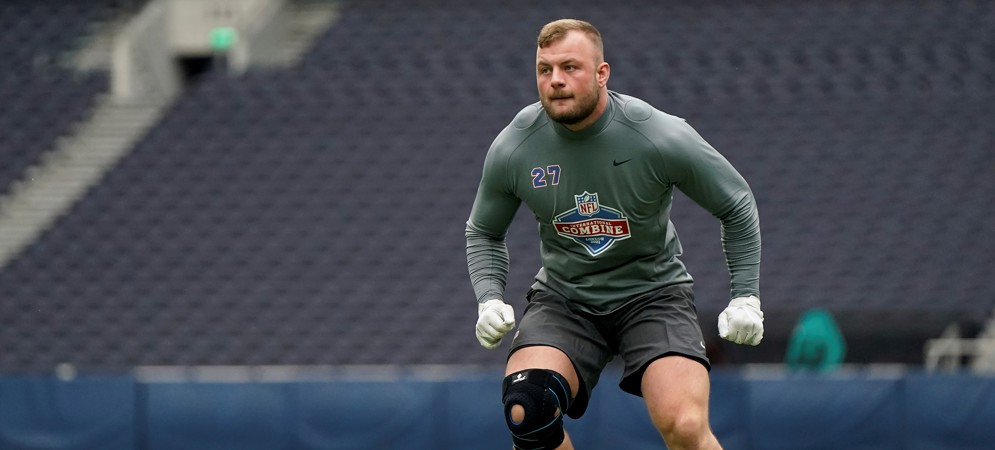
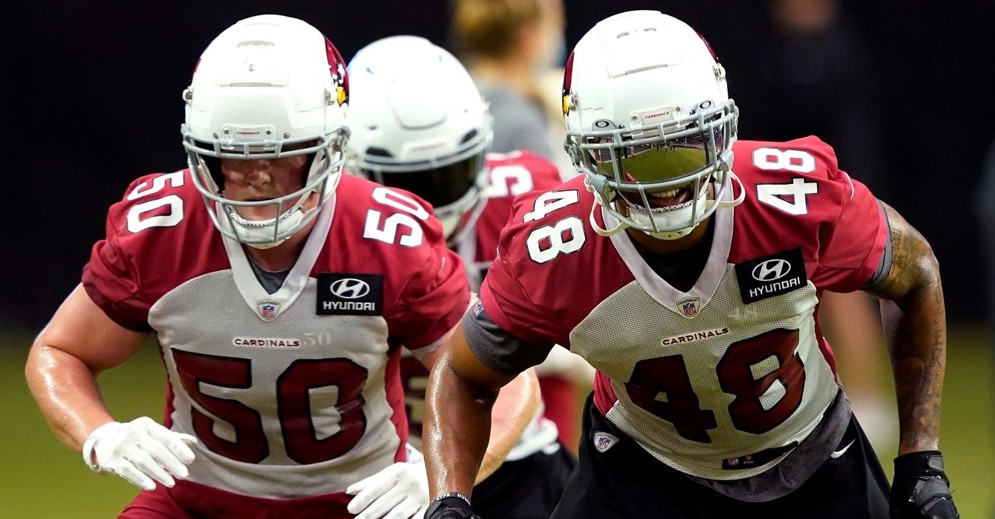
As part of the scouting and evaluation process, future NFL players will often participate in a series of position-level drills overseen by team scouts and other league personnel. The NFL’s Scouting Combine is one place where these drills occur, along with club pro days and other league events, including the NFL’s International Combine and HBCU Combine.
At the 2021 International Combine held at London’s Tottenham Hotspur stadium, NFL Football Operations staff experimented with new drills designed to more effectively align with NFL game player movement and mechanics during NFL games. For instance, an example of this drill modification would be drills for offensive linemen and linebackers that include 45-degree angle movements, actions that were previously uncaptured for those two position groups at the Scouting Combine. As a basis for capturing player movement, the league used an algorithm from a 2019 winning Big Data Bowl paper, as outlined here.
Below are several videos showcasing the newly implemented drills.
New Offensive Line Drill: 45-Degree Sprint
Players start with one knee down, then sprint at a 45-degree angle past a cone 10 yards away. This drill is replicated on each side.
New Offensive Line Drill: Pull Drill with 45-Degree Finish
Players start with one knee down, then pull and turn upfield through a cone 10 yards away. This drill is replicated on each side.
New Defensive Line Drill: Hurdle/Sprint/Cut on Demand
Players start with one knee down, then shuffle laterally over three bags, sprint forward, and finish by sprinting back through the starting cone.
New Linebacker Drill: Drop/Shuffle/Sprint
Players start with one knee down, then mimic a pass play by dropping back at a 45-degree angle, shuffling five yards, and finishing by catching a ball and sprinting through a cone.
New Wide Receiver Route: Crossing Pattern
Players start by running a crossing pattern before catching a ball and sprinting downfield.
In NFL games, crossing patterns represent 11% of all receiver routes, but were previously not tested at the combine. In London, these routes were tested at a depth of 18 yards.
How do NFL coaches use their timeouts?
November 10, 2021
NFL teams receive three timeouts each half. Timeouts can be used strategically to manage the clock or to avoid a penalty or unwelcome formation. Given the value of timeouts during end-of-game scenarios — ESPN Sports Data Scientist Brian Burke estimated that each second half timeout is worth about 3% in win probability — coaches are generally reluctant to call a timeout until the final minutes of each half.
To compare how current NFL coaches use their timeouts, we began by categorizing each timeout into one of the following categories:
Timeouts worth saving
These timeouts typically are called later in a half to conserve time on the game clock.
Time Saving, Offense: Called when a team is on offense, these timeouts typically come at the end of a half, and are called to stop the clock immediately after a play ends in order to conserve time on the game clock to reset ahead of the next play.
Time Saving, Defense: Called when a team is on defense, these timeouts typically come at the end of a half, and are called to stop the clock immediately after a play ends in order to try to get the ball back or conserve time on the game clock.
Timeouts coaches would like to have back
These timeouts typically are called earlier in a half when something doesn’t go as planned.
Unnecessary, Offense: Called when an offense is trying to avoid a delay of game or an uncertain play call.
Unnecessary, Defense: Called when a defense is dealing with substitution issues or when a coach is not confident in a defensive set.
Lost Challenges: Teams are docked a timeout after each failed instant replay challenge initiated by the head coach.
Other timeouts
Less than 5% of timeouts are called for other reasons, including timeouts for injured players with less than two minutes in a half, timeouts called right before the end of a half with a stopped clock, or timeouts meant to “ice the kicker.”
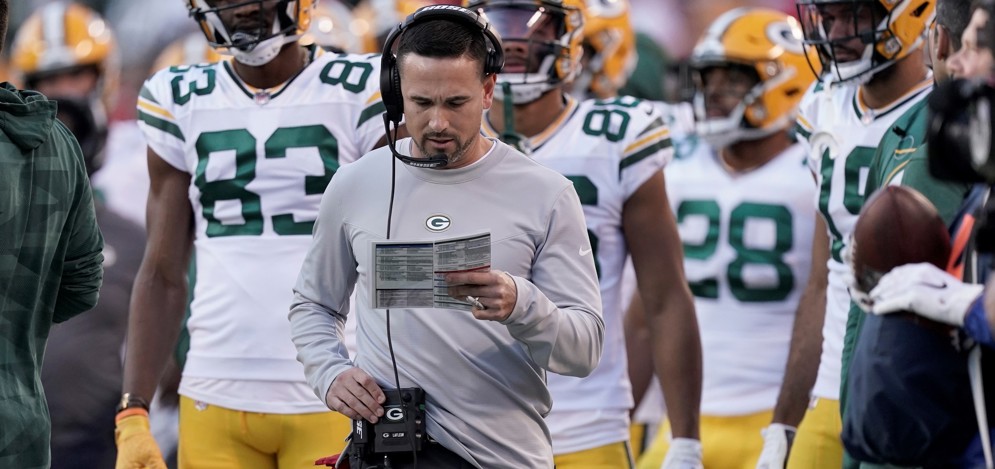
The following chart shows the first two categories of timeouts, plotted for each of the 31 current non-interim head coaches on a per-game basis from 2018–21 (Week 9).
The plot is ordered in terms of number of unnecessary timeouts (shown in red, orange, and yellow).
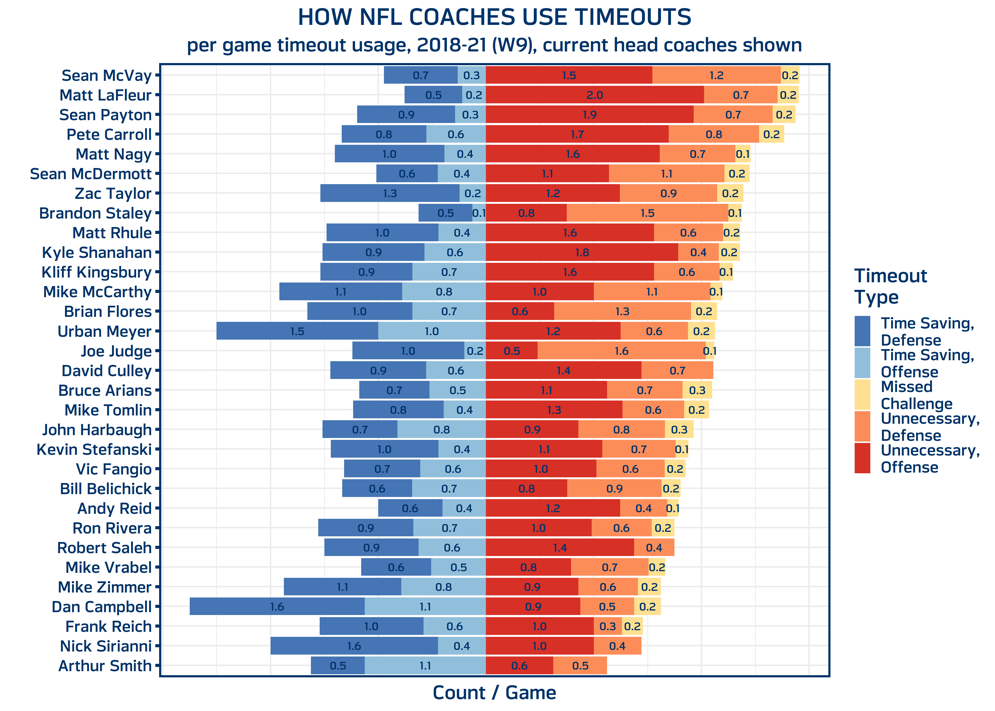
Current Rams head coach, Sean McVay, leads all coaches with 2.9 unnecessary timeouts per game (1.5 on offense, 1.2 on defense, and 0.2 in missed challenges), with Packers coach Matt LaFleur (2.9) and Saints coach Sean Payton (2.8) right behind. First-year head coaches Arthur Smith of the Falcons (1.1 per game) and Nick Sirianni of the Eagles (1.4) are most judicious with their timeouts.
First-year coaches Dan Campbell of the Lions (2.7 time saving timeouts per game) and Urban Meyer of the Jaguars (2.5) use the most time-saving timeouts, though much of that is likely driven by each team’s circumstance (the Lions are 0-8 and the Jaguars are 2-6).
Knowing each coach’s background gives additional context regarding offensive versus defensive timeout usage. The three head coaches with the highest total of unnecessary offensive timeouts are all former offensive coordinators — LaFleur, Payton, and 49ers coach Kyle Shanahan. The three coaches with the highest total of unnecessary defensive timeouts include former special-teams coordinator (Joe Judge of the Giants, 1.6 per game) and former defensive coordinators (Brandon Staley of the Chargers, 1.4 per game, and Brian Flores of the Dolphins, 1.3 per game).
Crowd noise may also play a role. If we compare by season and team — both home and away — we see that the 2020 season without fans featured 0.39 fewer unnecessary offensive challenges per game, relative to 2018, 2019, and 2021. And when there are fans, visiting teams call 0.19 more unnecessary offensive timeouts per game than home teams, a difference that is consistent across seasons.
Can Next Gen Stats Help Predict Pass Plays?
October 21, 2021
NFL officials prepare for games each week similarly to how NFL teams game plan for weekly opponents. In this instance, officials study team matchups for games they are assigned to, along with league-wide tendencies.
An aspect of a play that can change officials' responsibilities is whether the play is a designed run or drop-back pass. Penalties such as defensive holding, pass interference and roughing the passer are only typically called when the quarterback drops back to pass. Pre-snap tendencies can also aid officials when it comes to their responsibilities on a given play.
As a way of assessing league-wide offensive tendencies, the plot below uses the NFL’s Next Gen Stats locational data to visualize pass rates based on running back alignment. Only plays with the quarterback in shotgun formation with exactly one running back are used. Additionally, only locations (0.5 x 0.5 square yards) with a minimum sample of 10 plays are provided.

When the running back is aligned alongside the quarterback, the vertical and horizontal position of the ball carrier is a strong signal of the play type. For example, when the running back is two yards behind the quarterback, teams only pass the ball around 20% of the time (shown in the red cells). Alternatively, when the running back and quarterback are at equal depths (70% pass rate), or if the running back is in front of the quarterback (85% pass rate), the likelihood of a pass play is higher.
Teams lining up in the pistol set, where the ball carrier lines up behind the quarterback, tend to run the ball as well, though that rate increases when the ball carrier is closer to the quarterback.
Location-based passing tendencies can vary from team to team. For example, when analyzing plays with a single running back located 5 to 7 yards behind the line of scrimmage, the league average pass rate is 44%. But in 238 plays in those formations, the Dallas Cowboys passed the ball 67% of the time, while the Houston Texans only passed it 25% of the time in 265 total plays.
What record will be good enough to make this year’s NFL playoffs?
September 29, 2021
With the NFL’s recent expansions to a 14-team playoff in the 2020 season and a 17-game schedule this season, the calculus for identifying what win-loss records may be needed to make the playoffs may have changed, too.
To better understand the playoff implications of each win or loss, we used the nflSeedR package in the R Statistical Software to simulate 10,000 17-game NFL seasons based on historical estimates of team strength. Below, we visualize the probabilities for playoff, division, and top-seed hopefuls across the league.
The first chart shows the percentage of NFL teams that can expect to make the playoffs at each record (credit to FiveThirtyEight for the idea).
In the graph, teams that start 3-0 can expect to make the postseason 76% of the time. The odds drop with each loss; a team that starts 2-1 sees its chances drop to 55%, a 1-2 team drops to 32%, and a winless start means a team can only expect to make the postseason 14% of the time. Week 4 can provide additional clarity — if a 3-0 team wins to go 4-0, their expected chances of qualifying for the postseason jump to 85%. If that team falls to 3-1, the likelihood of earning a playoff spot drops to 67%.
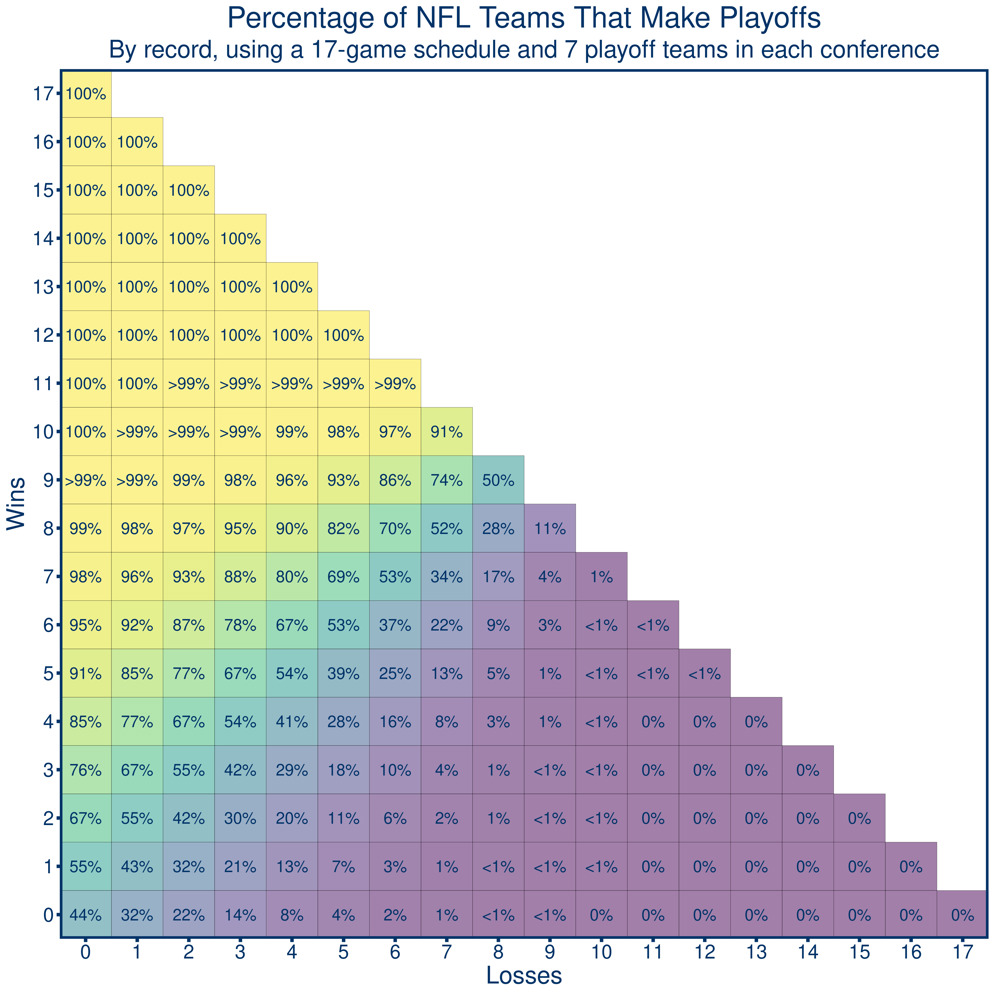
Additionally, the chart shows that extreme circumstances are still possible. For example, there’s about a 1% chance that
- A team finishing with a 7-10 record will make the playoffs
- A team that starts 8-0 will miss the playoffs
- A team that starts 0-7 will make the playoffs
Earning a playoff berth is not the only goal. Teams that win their division or finish as the conference’s top seed gain the advantage of playing playoff games at home. Here are similar charts showing the percentage of teams that win divisions and finish as top seeds.


Teams that start 3-0 have about a 51% chance of winning a division title and a 20% chance of earning the No. 1 seed. For 0-3 teams, those chances plummet to a 6% chance of winning their division and less than a 1% chance of earning their conference's No. 1 seed.
Assessing the Change in Draft Pick Value Across Positions
April 26, 2021
The 2021 NFL Draft is scheduled to kick off from April 29 to May 1 in Cleveland. Most of the pre-draft conversation has been centered around the quarterback position, with some mock drafts predicting four quarterbacks being taken with the first four picks.
If the pre-draft predictions hold true, how common is it for top draft picks to be used on the quarterback position?
Using a Draft Value Curve table, NFL Football Operations analyzed the overall draft capital devoted to each position in each NFL Draft from 1970 to 2020. The table, like others before it, aims to assess the relative value of each draft pick based on the performance of players chosen in each draft spot.
The first chart uses the percentage of draft value assigned to quarterback (blue), running back (green), and defensive back (red) positions since 1970.

During this time, the percentage of draft capital used on quarterbacks has increased. While they are only one of the 22 players on the field, they accounted for roughly 8% of total draft capital in the 2020 draft, consistent with the uptick that began roughly two decades ago.
With the passing game taking on greater importance, valuation of defensive backs has also increased. In five of the last six seasons, for example, defensive back ranked first among all positions as far as draft capital percentage — in the mid-1970s, it ranked as low as fifth.
Running back has seen the largest decline in draft capital over this period. In 1970, approximately 15% of draft capital was used on running backs — the third highest for any position. However, by 2020, the position dropped to seventh, falling behind quarterbacks and losing nearly 8% of draft capital.
The second chart shows the average draft capital allocated to each position group.

What data and analytics told us about 2021 Offseason NFL rules proposals
April 2, 2021
The 2021 NFL Playing Rule Proposals covered a variety of topics, including uniform numbers, overtime, and the instant replay review process. In mid-April, team owners will review and vote on each proposal. See how the NFL modifies or adopts new rules.
In March, the Football Operations Data and Analytics group provided the league’s Competition Committee with evidence to help them better understand several Playing Rules Proposals. Here are two examples.
Proposal Number 2: By Competition Committee; to amend Rule 6, Section 1, Article 3, for one year only, to establish a maximum number of players in the setup zone.
Playing Rule Proposal Number 2, proposed by the NFL’s Competition Committee, would change the rules for formations on kickoffs. Currently, at least eight players — but as many as 11 — are allowed in the setup zone, a 15-yard long rectangular box that begins 10 yards from where the ball is being kicked off (see the 2018 kickoff rules proposal here). The Competition Committee, with the support of NFL special teams coaches, proposed capping the number of players allowed in the setup zone at nine.
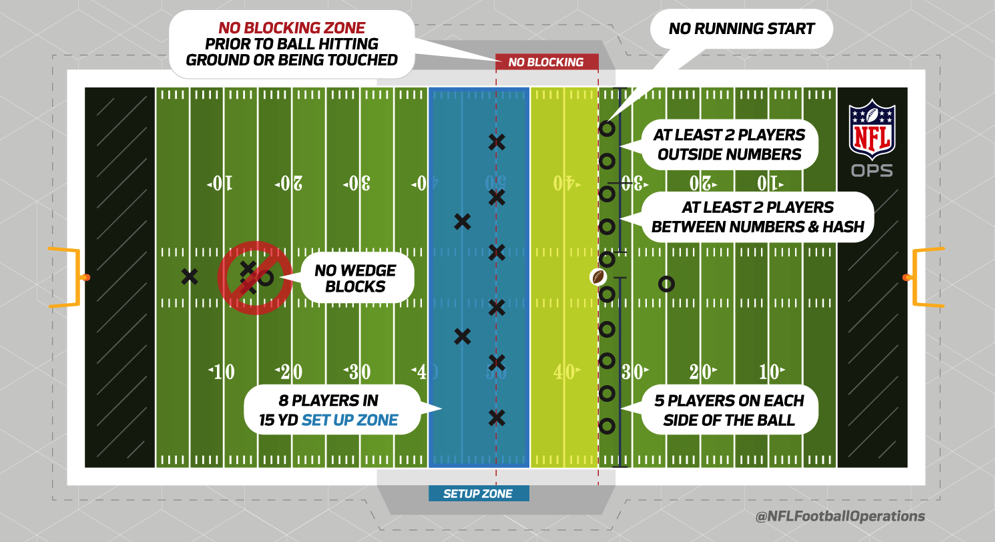
The data group used the NFL’s Next Gen Stats to identify if changing this rule could help increase the chances for a kicking team to recover an onside kick.
This table shows the frequency with which receiving teams put additional players in the setup zone, both when expecting an onside kick attempt and when not.
|
NUMBER OF PLAYERS IN THE SETUP ZONE, 2018-20 |
||||
|
8 |
9 |
10 |
11 |
|
|
Expected Onside |
0% |
0% |
87% |
13% |
|
Unexpected Onside |
98% |
<1% |
1% |
0% |
On every expected onside kick attempt from 2018-20, the receiving team loaded the setup zone with at least 10 players, and 13% of the time teams put 11 players in the zone. Alternatively, on 98% of kicks where an onside attempt was unexpected, receiving teams lined up the minimum of eight players in the setup zone.
Given this evidence, the league is testing a rule change to determine if limiting the number of players in the setup zone to nine may lead to new onside kick strategies and formations, and in turn, could lead to more recoveries.
By Baltimore and Philadelphia; to amend Rule 16, Section 1, to change the options available to the winner of an overtime coin toss and create a true sudden-death format.
Playing rule proposal Number 8, proposed by Baltimore and Philadelphia, would change NFL overtime to a “spot and choose” format. In this proposal, overtime would return to a sudden-death format (first score wins) and the starting location for the offensive team’s line of scrimmage would be determined by the coin toss.
The winner of the overtime coin toss would determine if they want to be the spot team or the choose team. The spot team first determines where the ball will be spotted, then the choose team selects whether to start on offense or defense.
The data team looked at the rate with which offensive teams scored first in first-half game situations based on the starting line of scrimmage on which a drive began. As shown in the chart below, the “break-even” point — the spot where both the possession and defensive teams are equally likely to score next — is the possession team’s own 13-yard line.

Of course, other game conditions — weather, team strengths, and how accurate a team’s kicker is — would factor into team decisions under this overtime format. Overall, though, we'd expect most spot teams to choose near the 13-yard line.
What does the NFL’s home-field advantage look like in 2020?
January 5, 2021
The 2020 regular season has seen NFL games played in empty stadiums, or in front of significantly reduced crowds. The lack of home fans may be contributing to an uncharacteristically low 127-125-1 (excluding three neutral site home games for San Francisco) record for home teams.
One group assuredly paying attention: sports bettors. Professional bettors and the sportsbooks that set lines are likely picking up on changes to the home advantage—no matter how small.
How have betting markets changed their perception of home advantage in 2020?
The plot below tracks betting market perception of the home-field advantage over the last decade.

The chart shows density curves corresponding to home-field advantage estimates from each season. Statistical models based on betting market data and inspired by this paper were used to determine home advantage estimates. These models take into account team strength, travel, and rest, in addition to home advantage.
Home field advantage had been slowly decreasing each season since 2006. However, 2020 has seen the biggest season-to-season drop over that time, dropping more than a full point from 2019. And the 1.30 point spread on average means home-field advantage is now worth less than half of what it was in 2006 (3.30 points).
We also checked whether the typical advantage provided to home teams has been constant throughout the 2020 season. Interestingly, the home advantage appeared to be higher in Weeks 1-7 (an average of 1.8 points) when compared to Weeks 8-14 (an average of 0.9 points). Perhaps, given results on the field, betting markets have adjusted.
Analyzing Defensive Pass Interference Fouls in the NFL and NCAA
November 20, 2020
Defensive pass interference (DPI) is one of the most impactful penalties in the NFL. With the way it is enforced, it is often suggested by fans and media alike that the rule should be modeled similarly to the NCAA. In the NFL, DPI is a spot foul, yielding an automatic first down to the team in possession. In NCAA football, the rule is slightly different — DPI is still a spot foul, but the maximum penalty is 15 yards.
How does DPI compare in the NFL and NCAA? NFL Football Operations breaks down three graphs that compare the two levels of football and provide further insights into the penalty.
Here’s the rate of DPI fouls per 100 pass attempts over the last several seasons.

Each season, there are more DPI calls per pass play between NCAA Power Five conference teams than in the NFL. One of the possible explanations is the increased weight of punishment is enough for NFL defenders to commit fewer fouls. For example, on deep pass plays, college defenders could aggressively prevent a catch to give up a smaller offensive gain than they would on a completed pass, even if DPI is called.
Next, here’s the percentage of overall penalties in a season that are DPI fouls.

Looking at all fouls committed in an NFL and NCAA season, a greater percentage of NCAA calls are DPIs, compared to the NFL.
Finally, below are penalty yards that result from DPI fouls.

The chart shows the variability of DPI penalty yards in the NFL compared to the NCAA with slightly more penalty yards at shorter distances in the NFL. Alternatively, 47.1% of NFL DPIs are 15 yards or more, while 56.1% of NCAA DPIs would be 15 yards or more, but they are capped at 15 yards.
Although the NFL’s lack of cap on penalty yards for DPI fouls increases the possible yardage impact, it could also decrease the frequency of these penalties.
Comparing Kickers Across the League on Accuracy Between the Uprights
October 22, 2020
Due to Justin Tucker having one of the strongest and most accurate legs in the NFL, some experts suggest that he may be the best kicker in league history.
Tucker’s kicks are so accurate that they sail directly through the uprights more often than any other NFL kicker, flying directly through over the center of the crossbar.
The chart below has kickers who led each NFL team in kick attempts since the start of the 2018 regular season and uses Next Gen Stats football tracking data to show each kicker's makes or misses on field goals and extra points. The data identifies where, relative to the uprights, each kick crossed the end line.

In the chart, kickers are sorted from most to least accurate (top left to bottom right), using data of each kicker’s average distance from the center of the upright. Tucker leads the way with kicks crossing an average of 1.10 yards from the center of the uprights, with Josh Lambo (1.11 yards away) a close second. On the other hand, Nick Folk (1.75 yards) posts the highest average error.
Alternatively, if the width of the uprights were to be cut in half (the crossbar is 18 feet, 6 inches in length and the top face is 10 feet above the ground), 73.8% of Tucker’s kicks would still be successful, compared to 58.5% for Folk's attempts.
The chart also identifies where kickers tend to miss. Brandon McManus has missed 10 kicks to the right of the uprights (5.6%), versus 4 kicks to the left of the uprights (2.2%). Of Stephen Hauschka’s attempts, 62% have sailed left of center, while Joey Slye kicks it right of center 68% of the time. (Note: our chart includes kickers who are not currently on NFL rosters)
Shorter kicks also play a major role in kickers’ accuracy compared to long distance ones. On field goals longer than 50 yards, the average distance from the center of the upright is 2.65 yards compared to 1.02 yards on field goals of 30 yards or less. Tucker is particularly accurate on kicks between 40 and 49 yards, where his average distance from the center of the upright is 1.15 yards, at least a half-yard more accurate than each of the kickers shown above.
No kicker in the league is more accurate from long distance than the New Orleans Saints’ Wil Lutz. Among kickers with at least 10 attempts of 50 yards or more, Lutz missed the center by an average of 1.97 yards.
Evaluating Subtle Differences in NFL QB Release Points
October 1, 2020
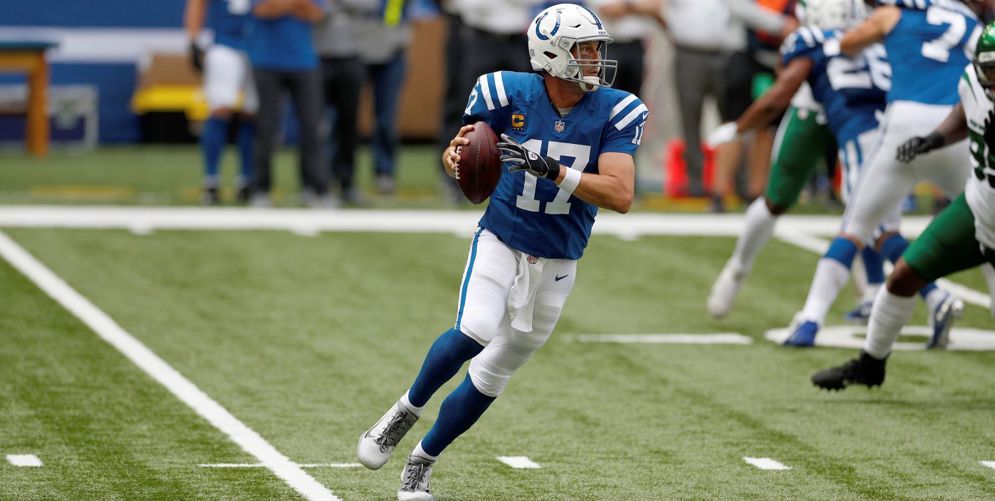
No two NFL quarterbacks are exactly alike. Some, like Philip Rivers, Drew Brees and Tom Brady, are more traditional pocket passers. Others, like Russell Wilson and Lamar Jackson, have shown they are more comfortable passing when they’re on the move. We can see this by looking at the pattern created from a quarterback’s dropback and release point. The result: each quarterback’s unique “fingerprint.”
Here is a chart using NFL Next Gen Stats data that shows pass release locations for each QB in 2020, in order of least variety in their positions to most. Each pass is a red dot, and the darkened blue to yellow density areas correspond to the frequency with which each quarterback throws from each spot behind the line of scrimmage.
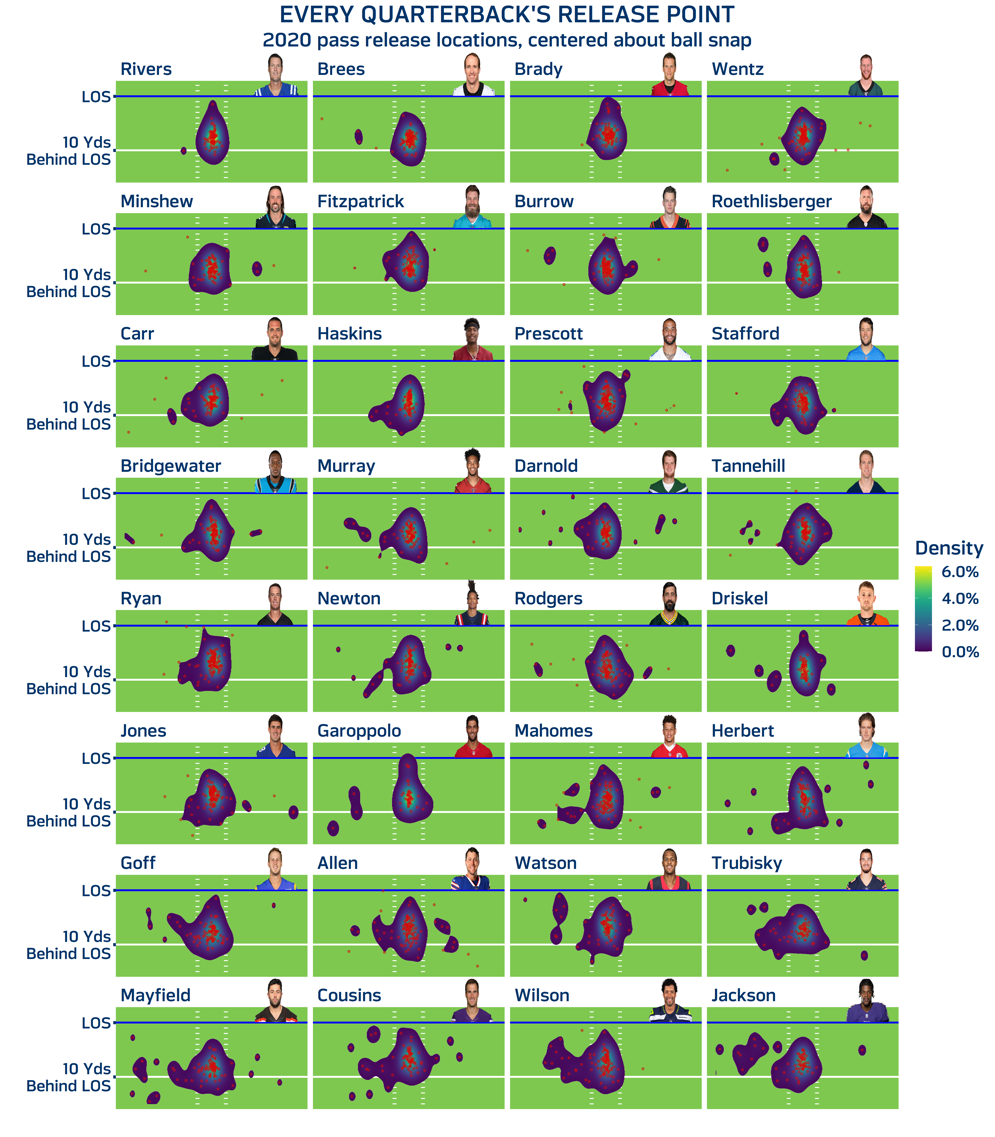
Rivers, Brees and Brady have the smallest variations in the locations from which they throw, with almost all release locations from a smaller area within the tackle box. QBs Wilson and Jackson cover more ground and throw from a wider variety of locations. Rivers throws 95% of his passes from within two yards to either side of the center (left to right), compared to 72% for Jackson. If you add up the collective area covered by Jackson’s release points in the plot above, he covers about 80 square yards of space, more than twice that of Rivers’ 38 square yards.
Tom Brady — Master of the QB Sneak
September 24, 2020
Tom Brady’s throwing ability and leadership have led to six Super Bowl victories, three league MVPs, and four Super Bowl MVPs. However, the QB sneak — which is how he scored his first touchdown as a Tampa Bay Buccaneer — is an often overlooked strength of his game.
Since 2001, Brady has led the NFL with 157 quarterback sneak attempts—85 more than Drew Brees, who is in second place. That equates to roughly one sneak every other game and outpaces his peers.
The first chart highlights both the frequency (x axis) and the average expected points added (y axis) for each QB’s sneak attempts since 2001. Brady is on the far right based on the frequency of his sneak attempts. However, based on expected points added per sneak, he falls in line with others. Expected points added (EPA) are derived using down, distance, yard line and time remaining.

In the bottom left, Peyton Manning, Russell Wilson, Brett Favre and Trent Green average fewer than one sneak every 12 starts and also average a negative EPA. Former St. Louis Rams quarterback Marc Bulger (top left) leads the group in average EPA per sneak attempt, but only averaged approximately one sneak attempt every 20 games.
Taken individually, Brady’s sneaks do not appear to have much of an effect, however the cumulative effect of Brady calling his own number dominates the competition over time. The second chart shows the cumulative EPA on QB sneaks through Week 1 of 2020. Each gray line represents each of the 214 quarterbacks who registered a sneak attempt since the 2001 season.

Brady stands alone in his career success, adding nearly 140 cumulative EPA over his career. That is roughly an extra touchdown each season for Brady-led teams from sneak attempts alone.
The top seven quarterbacks in sneak attempts are highlighted. Cam Newton — Brady’s replacement in New England — has also been a frequent sneaker, as have David Garrard, Donovan McNabb, Joe Flacco, Drew Brees and Carson Wentz.
Rookies on Week 1 Rosters
September 17, 2020
As NFL teams took the field in Week 1, we were curious to see if no preseason games and fewer practices affected how teams built their rosters. In particular, were rookies — with less opportunity to impress coaches than in previous years — more likely to be cut?
The following chart shows how many 2020 rookies made Week 1 rosters compared to each of the previous ten years. Each rookie is shown as a dot that corresponds with the year and round in which he was drafted, or if he went undrafted.

The biggest drop is seen with undrafted free agents (UDFAs), as 30.8 fewer UDFAs made 2020 rosters when compared to the average over the previous ten seasons.
Did roster spots usually taken by UDFAs then go to veteran players?
It turns out that some of those roster spots went to other rookies. Overall, 246 rookies in 2020 were named to Week 1 rosters — about 17 less than average. This was partially led by spikes in the number of players drafted in Round 3 (+5.2) and Round 4 (+5.2) that were on season-opening rosters this season.
More on the 2020 rookie class:
- There were 38 fourth-round picks on Week 1 rosters, the most since 2016 (Note: compensatory selections may be partially responsible for this increase)
- A total of 31 first-round picks made final rosters in 2020 — the most since 2018
- A total of 25 seventh-round picks made opening weekend rosters — the most since 2013
- Fifty rookies started in Week 1 games — the same number as in 2019. From 2010–18, an average of 41.3 rookies started Week 1 games.
Field Goal Success Probabilities by Direction
July 16, 2020

Down one point with 10 seconds remaining in an NFC Wild Card game against the Philadelphia Eagles, the Chicago Bears’ Cody Parkey attempted a 43-yard field goal. Parkey’s kick, eventually ruled to be partially blocked, deflected off the left upright then the crossbar, before falling into the end zone for a miss.
A deeper look shows that the so-called “Double Doink” was more difficult than a typical 43 yarder. Parkey not only was kicking in a game-winning scenario in the playoffs in January in Chicago, but he also was kicking north in Chicago — one of the most difficult kicking directions in the NFL.
Since 2000, kickers in Soldier Field have made 63.2% of 40-50-yard field goal attempts when kicking north, the lowest of any stadium/direction combination in the league. But don’t blame poor field goal kicking — when kicking south, kickers in Soldier Field have connected on 77.6% of attempts from that same distance, which is roughly the league average.
Turns out, there are six NFL stadiums where it’s notably more difficult to kick towards one end zone than the other.
In addition to Soldier Field, kickers have an easier time facing south at Arrowhead Stadium in Kansas City and Gillette Stadium in New England. Alternatively, kickers at the former home of the Raiders (Oakland Coliseum), Heinz Field in Pittsburgh and Raymond James Stadium in Tampa Bay kick better when facing north.
The following chart shows estimated success rates for field goal attempts between 40-60 yards at each of those six stadiums, separated based on kicker direction. Lines for kickers facing north are shown in red, while kickers facing south are shown in blue.

For Parkey, his 43-yard field goal attempt kicking towards the north end zone of Soldier Field yields roughly the same chance of success as a 49-yard field goal towards the south end zone.
Digging deeper within each stadium provides evidence for why some of these differences exist.
Soldier Field lies near Lake Michigan, which is known for unpredictable wind. The direction of the Soldier Field wind tends to point south about twice as often (67%) as it points north.
Arrowhead Stadium is symmetrical, but both ends of the stadium are relatively open. The stadium sees south-facing winds about 62% of the time, making it more difficult to make field goals when kicking to the north. This potentially affects extra points, too — kickers facing south at Arrowhead have hit 98% of extra point attempts since 2015, compared to 92% of north-facing attempts.
Gillette Stadium features a distinctive lighthouse in the open, north end zone, making conditions more difficult when compared to kicking into the closed end zone to the south. After a December 2018 game against the Buffalo Bills, Patriots coach Bill Belichick cited the open, lighthouse end of the stadium as a reason that he kept his offense on the field for a fourth-down attempt. Kickoffs are also impacted. Since 2011, when the NFL moved the kickoff to the 35-yard line, 48% of kickoffs to the south end zone at Gillette Stadium have gone for a touchback, compared to 40% to the north.
Heinz Field in Pittsburgh, like New England, has an open end zone to the south. The open end faces the Allegheny River, and on field goals of 40 yards or longer in this direction, Heinz Field kickers have hit just 57%, compared to 75% when facing north.
Raymond James Stadium in Tampa features winds that more often than not blow north, leading to more successful field goal attempts in that direction. South-facing field goals of 50 yards or fewer have been successful 80% of the time, compared to 88% when kickers faced north. Gusts out of the south were so strong before a 2018 game that the netting behind the end zone got tangled up with the uprights.
Oakland Coliseum, the former home of the Raiders, is more of an enigma. Since 2003, field goal attempts facing south have been 6.7% less likely to go in when compared to the north — the largest difference in the league. The Coliseum is symmetrical, and the winds disproportionately point west (83% of games), so there is no clear advantage from the wind or a closed end of the stadium. The Coliseum was also home to baseball’s Oakland Athletics — throw in the A’s dirt infield, and kickers faced a variety of conditions that could have affected kicking.
Are coaches aware of these differences?
Assessing if team behavior changes based on kick direction is not straightforward, but the average field goal distance in each direction may be telling. For example, If worries about kicking north in Chicago impacted coaching decisions, perhaps the average field goal distance for north-facing attempts would be lower.
We checked the average field goal distance when kicking north or south in all current and former stadiums, and none of the six examples above ranked in the top-15 in terms of differences. In fact, New England and Pittsburgh both had the two smallest differences in the league — less than 0.05 yards for an average distance between north and south end zones.
If coaches have picked up on the different trends, it does not appear to be showing in terms of average distance.
Going for it on Fourth Down Becoming the New Norm for NFL Coaches
April 21, 2020
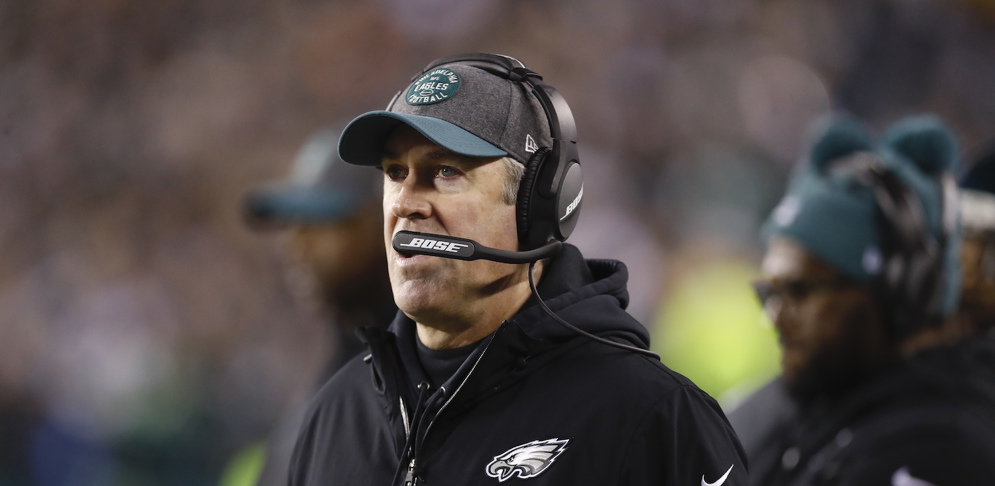
In 2013, a New York Times project compared the fourth-down decisions made by NFL head coaches to a statistically-driven “4th-Down Bot.” At the time, there was a wide disparity between what the bot suggested and what the coaches did in live game situations.
Seven years later, the increased use of football analytics has also led to it becoming more normal for teams to go for it on fourth down with five or fewer yards to gain. In 2019, teams went for a first down 26.2% of the time on non-high leverage fourth downs (fourth-and-five yards or fewer to gain), the highest rate in at least two decades.
The charts below mimic the ideas of the bot’s originators. The charts use data from 2000 to present when games are close, and show current head coaches with two or more years of head coaching experience. The colors of the rectangles are determined by using a weighted sum favoring recent years. The most aggressive coaches are in the top left of the chart and the least aggressive are in the bottom right.

Philadelphia Eagles head coach Doug Pederson was the coach who was most likely to go for it in these situations, especially in fourth-and-one situations.
Interestingly, Tampa Bay Buccaneers head coach Bruce Arians, known for his downfield passing offense, is among the least aggressive head coaches on fourth down and less than five yards, while Baltimore Ravens head coach John Harbaugh, known for his focus on the run, is among the most willing to go for it.
When looking at the 11 most aggressive coaches, seven of them made the playoffs last year. Additionally, three out of the remaining four — Mike Tomlin, Dan Quinn and Ron Rivera — led their teams to a Super Bowl in previous seasons.
Probability models for the new 14-team playoff system
April 6, 2020

Last week, the NFL owners voted to expand the postseason from six to seven teams per conference. In the new format, the No. 1 seed is now the only team with a first-round bye. The No. 2 seed will face the No. 7 seed on Wild Card weekend. The third through sixth seed opening matchups remain the same as they were under the 12-team format that went into effect in 1990.
The graph below shows how each seed’s estimated probability of winning the Super Bowl changes under the new playoff format. The dots represent the probability of winning the Super Bowl under the old format, the arrow extends to the new probability under this format. The text on the right shows the change in probability.
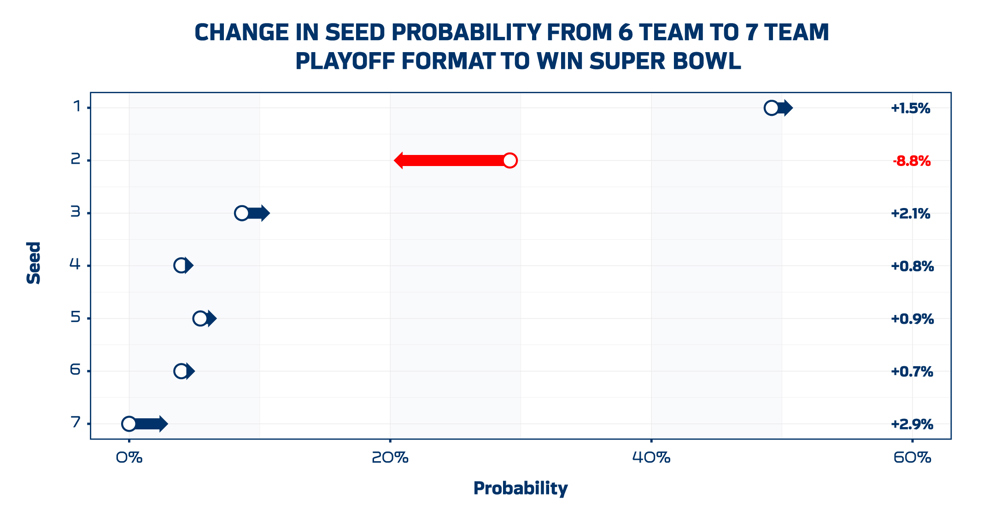
Statistical models inspired by this paper were used to determine a distribution of each team’s strength, the value of home-field advantage and the value of having a bye. For each game, these factors were used to determine each team’s probability of winning any given matchup. Under this model, we simulated the playoffs 100,000 times for each format with a variety of possible team strengths for each seed to account for how each postseason can differ. The number of Super Bowl wins by seed is divided by the number of simulations to calculate the probabilities.
Only the No. 2 seed sees a decrease in the probability of winning the Super Bowl — primarily because they lose a first-round bye and now play an additional game, introducing another chance to be eliminated. The probability for the No. 1 seed increases because it now has a lower chance of playing the No. 2 seed in the Conference Championship, and a greater chance of playing a lower-seeded team. The probabilities of the remaining seeds all increase because they are now more likely to avoid higher-seeded teams and to host a playoff game in the Divisional or Conference Rounds. Since the No. 7 seed didn’t exist before, its probability increases from 0% to 2.9%.
Interestingly, the No. 5 seed has a slightly higher probability than the No. 4 seed in both formats. This is likely because the fifth seed often has a better record (and underlying team strength) as the best of the 12 non-division winners, while the No. 4 seed has the worst record of the four division winners.
This new format makes earning the top seed more important and gives two additional teams a chance to compete for the Lombardi Trophy, which should lead to even more exciting regular season and playoff football.
Big Data Bowl Winning Paper Leads to New Drill at the NFL Combine
March 4, 2020
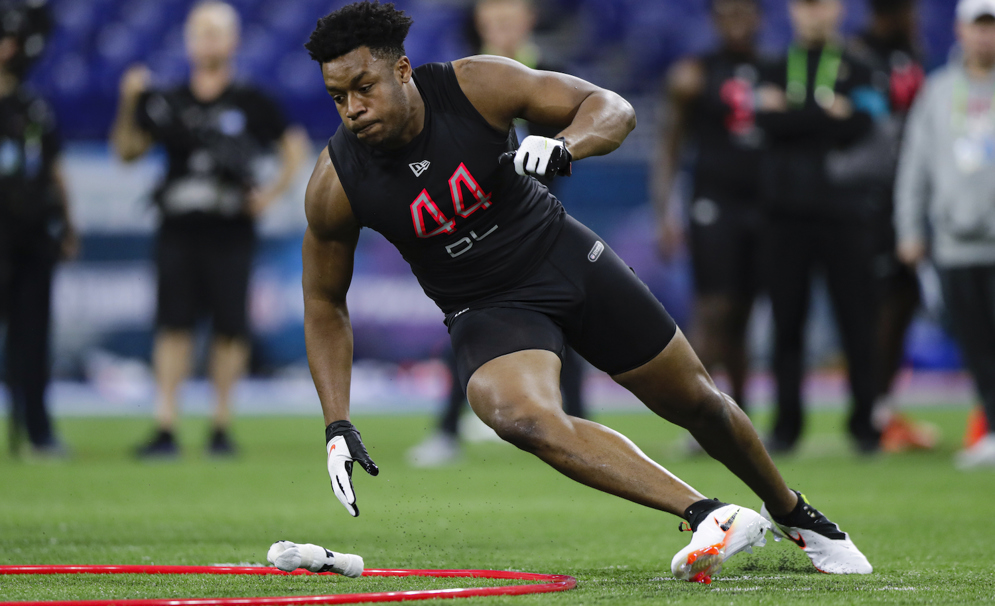
This past weekend at the NFL’s Scouting Combine in Indianapolis, defensive linemen were tested in a timed “Figure 8” drill (also called the “Hoop” drill). In a Figure 8 drill, linemen start next to one of two adjacent circles. They sprint halfway around the first circle, before making a complete loop around the second circle, then around the remaining section of the first circle ending back at the starting line.
Check out LSU defensive end Rashard Lawrence in the clip below.
Lawrence also picks up and discards two towels on the ground. The towels mimic where the defenders’ hands often end up on a pass rush.
Defenders are likely used to this drill from their high school or college practices, and with good reason — the path closely mimics player movement on the field.
Here’s how the Football Operations data and analytics team helped propose the Figure 8, with a hat tip to the College Division winners of the 2019 Big Data Bowl.
The 2019 winning paper, “Routes to Success,” was written by four students from Simon Fraser University — Dani Chu, Lucas Wu, Matthew Reyers and James Thomson. Though the original paper tracked the most common wide receiver patterns, the algorithm easily translates to other positions. Last summer, the students worked with the NFL Football Operations team to modify it for defensive linemen.
Using Next Gen Stats player tracking data, Chu, Wu, Reyers and Thomson generated the most common movements on run and pass plays for all positions on the field. Here’s an animation showing how all defensive end movement on pass plays can be grouped, initially from one for each team, to one for each of nine common movements, shown at the end of the animation.

The nine most common movements for defensive ends are shown below. For example, the most common defensive end movement (top left) is an outside pass rush, lasting an average of 4.38 seconds and ending around five yards upfield. Alternative paths are shown in the remaining clusters. For example, clusters seven and nine show the ends rushing upfield before sprinting sideways.

Look familiar? Most of the common patterns feature players moving in curved patterns — curved patterns that are also represented in the Figure 8 drill. Armed with this data, the NFL implemented a version of the Figure 8 drill at the International Combine in Germany before bringing it to Indianapolis this past weekend.
The Figure 8 was one of several new drills at the 2020 Combine. It was a concept that started with Next Gen Stats and came to fruition thanks to the hard work of students at last year’s Big Data Bowl.
2020 Big Data Bowl Recap
February 27, 2020
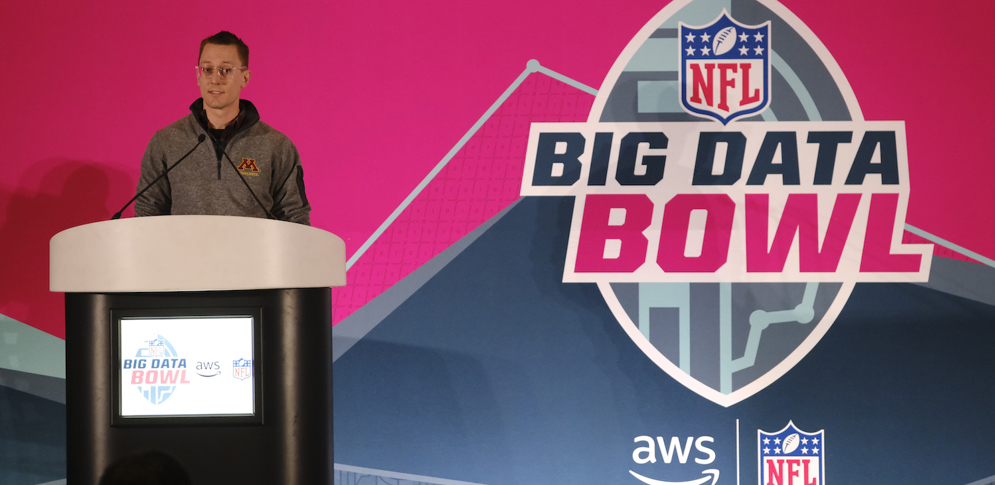
The second annual Big Data Bowl, powered by Amazon Web Services (AWS), focused on predicting the outcomes of rushing plays during the 2019 season. Participants were provided with the NFL's Next Gen Stats, including speed, direction, and location information for all 22 players on the field at the moment a ball carrier receives the ball, and were tasked with predicting where the ball carrier would end up.
This year, six collegiate finalists presented their work to NFL club analytics staff at the NFL Combine in Indianapolis. Three honorable mention papers were also named. Below is a summary of each presentation and a link to the complete entry.
Grand Finalist
Matt Ploenzke (Harvard)

Matt Ploenzke (AJ Mast/AP Images for NFL)
Ploenzke used Next Gen Stats data to build interpretable model inputs based upon football-specific domain knowledge, ultimately highlighting the importance of ball carrier downfield acceleration and unblocked tackler distance and spacing.
Key stat: Among roughly 40 input variables, a ball carrier’s “effective acceleration” was the most important for estimating yards gained on a handoff play.
Download Matt Ploenzke’s paper.
FINALISTS
Kellin Rumsey, Brandon DeFlon (University of New Mexico)
The battle between blocker and defender is often decided by leverage. In this paper, Rumsey and DeFlon define offensive and defensive leverage, and study the statistical properties of these metrics.
Key stat: In the first six weeks of the 2017 season, Blake Martinez (Green Bay Packers) was among the league’s best at generating defensive leverage. Martinez finished the season with the third-most solo tackles (96).
Download Kellin Rumsey and Brandon DeFlon’s paper.
Graham Pash, Walker Powell (NC State)
Pash and Powell used kinematic data such as player positions and velocity to determine zones of control for both the offensive and defensive teams at the time of the handoff. These zones of control predict the probabilities of yards lost or gained and quantifies the risk involved with plays.
Key stat: Robert Woods (Los Angeles Rams) and Raheem Mostert (San Francisco 49ers) outperformed the model predictions the most, averaging nearly three more yards than predicted over the 2017 and 2018 seasons.
Download Graham Pash and Walker Powell’s paper.
Namrata Ray, Jugal Marfatia (Washington State University)
Ray and Marfatia measured the open space of the rusher at three time intervals — handoff, after a half-second, and after one second — to understand the association between open space and yards gained. Results indicated that the difference in the open space between the time of handoff and after a half-second or full second was a strong predictor of the number of yards gained.
Key Stat: Yards gained by the rusher increases by four yards on average for every one percent increase in the additional open area created within a half-second of the handoff.
Download Namrata Ray and Jugal Marfatia’s paper.
Alex Stern (University of Virginia)
Using an advanced machine learning algorithm, Stern assessed the value of initial space created for the ball carrier by the offensive line. That space was then linked to linemen grades, and standardized by accounting for the number of defensive backs, linebackers and defensive linemen on the play, the defensive strength of the opposing team, and the running direction of the running back.
Key Stat: In 2018, New Orleans Saints center Max Unger received a top five grade according to Stern’s space grade rank for centers, despite being the 31st-graded run blocker by Pro Football Focus.
Caio Brighenti (Colgate University)
Brighenti computed each team's control of the field at the moment of the handoff to predict the outcome of rushes. Brighenti found that offensive control at the running back's expected point of intersection with the line of scrimmage was the most important predictor of run yardage.
Key Stat: The critical factor separating successful and unsuccessful plays is ownership of the run gap at the line of scrimmage — even on plays gaining more than 10 yards, the difference in field control past the line of scrimmage was almost negligible.
Download Caio Brighenti ’s paper.
Honorable mention papers
Bryant Davis (University of Florida)
Predicting Rushing Yards Using a Convolutional Autoencoder for Space Ownership
Aaron Kruchten (Carnegie Mellon)
Estimating the Causal Effect of Defensive Formation on Yards Gained in Run Plays
Lucas Wu, Dani Chu, Matthew Reyers (Simon Fraser)
Breaking Through the Line: Evaluating Running Back Contributions to Running Plays
What the Top Predictions Looked Like in the NFL's Big Data Bowl
January 27, 2020
As part of the NFL’s second Big Data Bowl, more than 2,000 data scientists from all over the world competed on Kaggle to predict rushing play outcomes over the last five weeks of the 2019 regular season.
Data scientists Phillip Singer and Dmitry Gordeev from Austria captured the top prize of $50,000 with their highly technical approach. Nicknamed The Zoo on Kaggle, Singer and Gordeev’s team led throughout the contest, besting second place by the same scoring margin that separated second place and 24th place.
The Zoo posted their predictions on Kaggle, and today’s Extra Point assesses how closely their predictions matched what happened on the field. Note: each prediction was made only using run plays from the past. In statistical terms, these are considered out-of-sample predictions.
What was being predicted?
The goal of the Kaggle contest was to predict where every ball carrier would end up on a handoff play. Participants were given several characteristics of the play, including the NFL’s Next Gen Stats, and game and play traits such as the down, distance, starting yard line and which players are on the field.
For example, on this Cordarrelle Patterson carry for the Chicago Bears in Week 1 against the Green Bay Packers, Patterson barely had a chance of reaching the line of scrimmage. The Zoo assigned the following probabilities:
Patterson:
- loses 3 yards or more: 9.4%
- loses 2 yards: 19.4%
- loses 1 yard: 19.9%
- gains 0 yards: 21.4%
- gains 1 yard: 11.5%
- gains 2 yards: 6.9%
- gains 3 yards or more: 7.2%
Patterson lost 2 yards on the play — one of the three most likely outcomes predicted by The Zoo’s model.
While predictions on Patterson’s carry were grouped near zero yards, on this Raheem Mostert 41-yard touchdown run against the Carolina Panthers in Week 8, The Zoo gave the San Francisco 49ers back a 10.5% chance of reaching the end zone — making it more likely that he would score than Patterson was to pick up three yards. According to The Zoo, Mostert had a 61% chance of picking up 10 yards or more on his carry.
How accurate was The Zoo across all handoff plays?
Looking at all Big Data Bowl plays from Weeks 1–12 provides a sense of how precise these predictions were. The following chart groups each carry into a predicted number of yards, and averages the observed yardage gained within each group of predictions. The black dotted line corresponds to settings where predictions perfectly matched reality.

By and large, The Zoo’s predictions reflected what eventually happened on 2019 carries. For example, there were precisely five carries where The Zoo’s model predicted that the most likely yardage gained would be 20 yards — on those carries, the ball carriers averaged 19.2 yards. The Zoo’s most common yardage prediction was four yards, and of the 1,543 carries where four yards was the prediction, ball carriers averaged 3.98 yards.
Predicting football outcomes is challenging, and the predictions made as part of the Big Data Bowl were no different. The Zoo’s most likely rushing distance on each play was an exact match on only 17.6% of plays, which means that more than four out of every five times, the offenses over or underperformed expectations. But being able to better understand what goes into successful plays — separating Patterson’s carry from Mostert’s, for example — gives us deeper insight into what drives ball carrier success.
On February 26, The Zoo and other Kaggle top finishers will join finalists from the Big Data Bowl collegiate contest and present their results to NFL team analytics staff at the Scouting Combine in Indianapolis.
Why Fourth-and-15 from the 25? Insight into the NFL’s experiment with an onside-kick alternative
January 24, 2020
In the 2020 Pro Bowl, a team scoring a touchdown or field goal will be able to attempt a fourth-and-15 offensive play from its own 25-yard line to try to keep possession of the football. If the offense converts, it keeps the ball; if it falls short, the defending team takes over at the dead ball spot.
Why this experiment? In today’s post, we’ll explain how the league used analytics to inform this potential onside kick alternative.
The Football Operations data and analytics team’s first research into an onside kick alternative began before the NFL’s offseason meetings in March of 2019, when the Denver Broncos proposed a rule change that would give scoring teams the option of using one fourth-and-15 play each game. Under Denver’s proposal, the scrimmage play would occur from a team’s own 35-yard line. Denver was motivated by the decline in onside kick recovery rates. Kicking teams historically recovered onside kicks between 15% and 20% of the time in a given season. In 2018, in part to changes on the kickoff play, that number dropped below 10%.
The league’s challenge: How to give teams an opportunity to maintain possession by using game play instead of the onside kick.
The first aspect of game play we looked at was how often teams convert on third and fourth down given various yards to gain. But plays aren’t simply “convert” or “not convert” — on several plays, penalties either give the offense the first down, or require the offense to start over from a different position.
Here’s a chart that shows the complete set of scrimmage play outcomes, using plays from 2002 through 2018. Only plays run with a score differential of eight points or fewer are included, and those run within the last two minutes of each half are dropped.

The light red band reflects the percentage of plays where the offense picks up a first down on the play, while the dark red corresponds to first downs picked up by penalties (defensive holding and defensive pass interference, for example, lead to automatic first downs). The dark blue areas correspond to what we termed as “do-overs,” in which the offense keeps possession but needs to attempt a play from a new line of scrimmage. Finally, the areas in light blue are defensive stops.
In reality, the closest match for an onside kick is to follow a team attempting a fourth-down play until either it has picked up a first down or a defensive stop is made, while also accounting for the do-overs. In other words, if 100 teams attempt a fourth-and-15 but pick up an offensive holding penalty, at least one of those teams is going to convert the ensuing fourth-and-25.
Accounting for do-overs, we settled on the following chart to compare Denver’s proposal of a fourth-and-15 with the historical onside kick recovery rate of 13.2%.

Denver’s proposal is slightly more forgiving than the onside kick (note: we used only expected onside kicks in this calculation), although the differences are within a few percentage points. A perfect comparison for the historical onside play would be a fourth-and-17 scrimmage play.
Lastly, we searched for the best yard line to use for the scrimmage play. Although Denver suggested the 35-yard line — the same as where teams kick off — teams that pick up first downs on scrimmage plays typically gain more yards than just the line to gain. Teams converting on fourth-and-14 to fourth-and-16 typically end up eight yards past the line to gain when they convert. Our suggestion then — and the yard line that we’re testing at Pro Bowl — will push offensive teams back 10 yards to their own 25-yard line.
Punters in 2019 Were Performing Better Than Ever
January 17, 2020
While the improvement of NFL placekickers over the last few decades has been celebrated repeatedly, another group of specialists is performing better than they ever have: punters.
Check out the following stats comparing regular season play from 2000 to 2019:
- Nearly one quarter of of punts (23.3%) from near midfield — between the 48 yard lines — resulted in a touchback in the 2000 season. In 2019, that rate dropped to just under 10% (9.8%).
- There were 110 total regular season touchbacks in 2019, 56% fewer than in 2000 when there were 247.
- The net punting average was 5.8 yards higher in 2019 than it was in 2000 — even after accounting for differences in field position between the two seasons of play.
- The punter with the lowest per-punt average in 2019 — Dallas’ Chris Jones, at 41.6 yards — would have been ranked No. 17 in 2000 — or league average.
The combination of punt distances and net punting averages going up, along with touchback rates going down, means that offensive teams were more likely to be pinned back deep in their own territory in 2019.
The following chart shows the likelihood of an offensive team starting inside its own 20 yard line after receiving a punt. The lines show different territories of the field, each corresponding to the area from where the opponent punted.

For example, when a team punted from between its own 31 and 40 yard lines, only about one in four punts in the early 2000s would pin the receiving team inside it’s own 20-yard line. In 2019, it was closer to one in two (45.1%). Similarly, when a team punted from between it’s own 41 yard-line and midfield in 2019, 70.1% of punts pinned the receiving team inside its own 20 — about 1.4 times the rate from 2000.
It’s not just the 20-yard line that teams are offenses are finding themselves behind. On kicks from near midfield, the likelihood of the receiving team starting from inside its own 10-yard line went up by a factor of 1.7, from 17.5% in 2000 to 31.0% in 2019.
More Girls are Playing Tackle Football
January 9, 2020
Tackle football has traditionally been a boys sport, but that’s starting to change. Spurred in part by girls-only tackle football leagues in Utah and Texas, 47 of 50 states saw an increase in the percentage of girls who play high school tackle football in 2018 compared to a decade ago.
The following heatmaps show the percentage change of high school 11-person tackle football players that were girls using participation data from NFHS.


In California, the percentage of girls playing was 4.7 times higher in 2018, jumping from 0.14% of players to 0.65% of players. California’s 593 girls playing tackle football was the highest total among all states. Nearby New Mexico had the highest percentage, with girls making up more than 1 percent of all players in 2018.
On the other side of the country, 204 girls played tackle football in 2018 in New Jersey, a rate that was 6.3 times higher than in 2008. Throughout the Northeast region, the rate of girls on teams grew by a factor of 5.9, with large jumps in participation in Rhode Island, New Hampshire and Vermont.
Across the country, 2,404 girls played tackle football in 2018.
Tackle football isn’t the only way girls participation continues to grow. Georgia in 2019 became the fourth state to sanction girls flag football as an official high school sport — an effort that was led by the Atlanta Falcons and the Arthur M. Blank Family Foundation — and the Tampa Bay Buccaneers just allocated $250,000 to create the first ever girls flag scholarship program.
The Biggest NFL Comebacks of the Last Decade
December 31, 2019
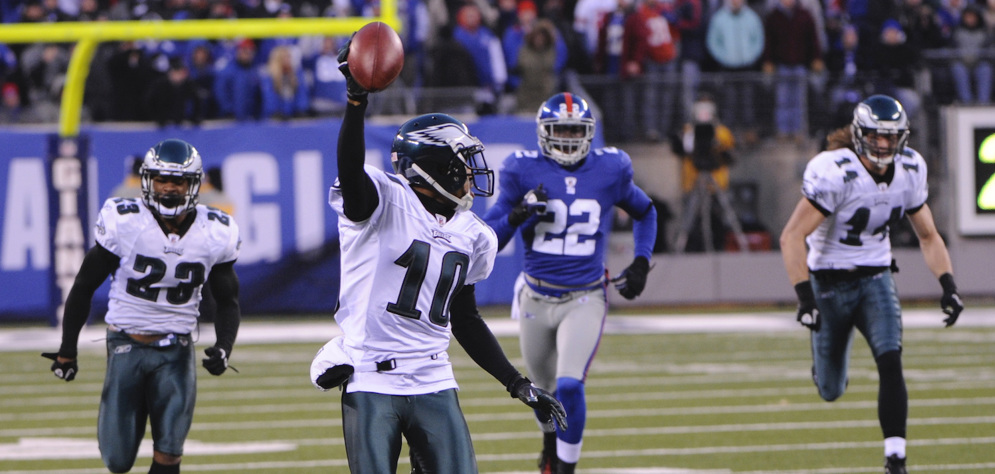
With only 11 postseason games left in the last season of the 2010s, let’s use our win probability model to look at which teams overcame the longest odds to win games over the last decade.
While Super Bowl LI provided the most memorable comeback of the last decade, with the New England Patriots erasing a 28-3 halftime deficit to upend the Atlanta Falcons, our model identified four other games where teams overcame longer odds to win.
Here are the top 10 least likely comebacks of the decade. Details of each comeback are provided below.

1. Philadelphia Eagles vs. New York Giants, Week 15 2010. Comeback odds: 1 in 252.
With 8:17 remaining in the game, the Eagles trailed 31-10. A 65-yard touchdown pass, successful onside kick, and a Michael Vick touchdown run cut the deficit to seven with just over four minutes remaining. After a Giants drive stalled, the Eagles drove the length of the field to tie the game with 1:16 remaining. After another New York drive stalled, DeSean Jackson returned the ensuing punt 65 yards for the game-winning touchdown as time expired. The game became known as the “Miracle at the New Meadowlands,” and it’s our most surprising comeback of the 2010s.
Here’s the win probability plot showing each team’s chances throughout the game.

2. Tampa Bay Buccaneers vs. Carolina Panthers, Week 11 2012. Comeback odds: 1 in 165
With 1:02 left in the fourth quarter, the Buccaneers trailed 21-13 and had the ball at their own 20-yard line with no timeouts. Josh Freeman led an 80-yard touchdown drive — including a two-point conversion — to force overtime. Tampa won the game 27-21 with a touchdown on the opening drive of overtime.
3. New Orleans Saints vs. Washington Redskins, Week 11 2017. Comeback odds: 1 in 159
With 4:14 in the fourth quarter, Washington led New Orleans, 31-16. The Saints converted a big third down and eventually scored a touchdown to cut the lead to 31-23. A Redskins three-and-out was followed by another New Orleans touchdown and two-point conversion that tied the game. The Saints won in overtime, 34-31.
4. Detroit Lions vs. Dallas Cowboys, Week 4 2011. Comeback odds: 1 in 153
With 10:30 left in the third quarter, Dallas had the ball and a 27-3 lead. On the next play, Tony Romo threw a pick-six to make it 27-10. Another Romo pick, followed by a rejuvenated Lions offense scoring a touchdown, touchdown, field goal, and a touchdown on its second-half drives, led to a 34-30 Detroit win. This game is the only one on our list where the lowest odds of winning came in the third quarter.
5. New England Patriots vs. Atlanta Falcons, Super Bowl LI 2016. Comeback odds: 1 in 142
This game is known as the 28-3 comeback, but New England’s lowest odds of winning actually came with 8:31 left in the game. The Falcons had the ball and a 28-12 lead when Dont’a Hightower forced a fumble and a sack, which led to a New England touchdown and two-point conversion. Another sack and holding penalty ended another Falcons drive. The Patriots tied the game with another touchdown and two-point conversion and scored a touchdown on the first overtime possession to win 34-28.
6. Oakland Raiders vs. Cleveland Browns, Week 4 2018. Comeback odds: 1 in 141
With 1:41 remaining, the Raiders trailed the Browns by eight when they turned the ball over on downs. Oakland forced a three-and-out and got the ball back with 1:28 left. The Raiders drove downfield for a touchdown and two-point conversion to force overtime, where they won on a 29-yard field goal.
7. Seattle Seahawks vs. Green Bay Packers, NFC Championship 2014. Comeback odds: 1 in 136
At the 4:57 mark of the fourth quarter, the Packers had the ball and a 19-7 lead. After Seattle forced a three-and-out, a Russell Wilson touchdown cut the lead to 19-14 with 2:09 left. The Seahawks recovered an onside kick and drove down the field for a touchdown and a 22-19 lead with 1:19 remaining. The Packers kicked a field goal to force overtime, but Wilson connected with Jermaine Kearse on a 35-yard game-winning touchdown pass, which sent Seattle to Super Bowl XLIX.
8. Indianapolis Colts vs. Detroit Lions, Week 13 2012. Comeback odds: 1 in 99
With 4:24 remaining in the fourth quarter, the Colts trailed the Lions by 12 points. A Detroit drive stalled at midfield and Indianapolis forced a punt. An Andrew Luck touchdown pass made it 33-28 Lions with 2:39 left. Indy’s defense held and they got the ball back at their own 25 with 1:07 left and no timeouts. Luck led a game-winning drive that culminated with a touchdown pass to Donnie Avery as time expired.
9. Kansas City Chiefs vs. San Diego Chargers, Week 1 2016. Comeback odds: 1 in 89
With 12:53 remaining in the fourth quarter and the Chiefs trailing 27-10, Kansas City quarterback Alex Smith threw an interception. A missed Chargers field goal, and three straight scoring drives from Kansas City mixed with two failed San Diego drives led to the Chiefs tying the game with a minute left. Kansas City won the game in overtime.
10. Denver Broncos vs. Miami Dolphins, Week 7 2011. Comeback odds: 1 in 80
With 5:50 left in the fourth quarter and the Broncos trailing the Dolphins 15-0, Denver punted the ball to Miami. After forcing a three-and-out, Tim Tebow led the Broncos on an eight-play touchdown drive to cut the deficit to 15-7. Denver recovered the onside kick and Tebow orchestrated a game-winning drive, culminating with a Broncos touchdown with 17 seconds remaining. Denver won in overtime.
When are teams being more aggressive on fourth down?
December 24, 2019
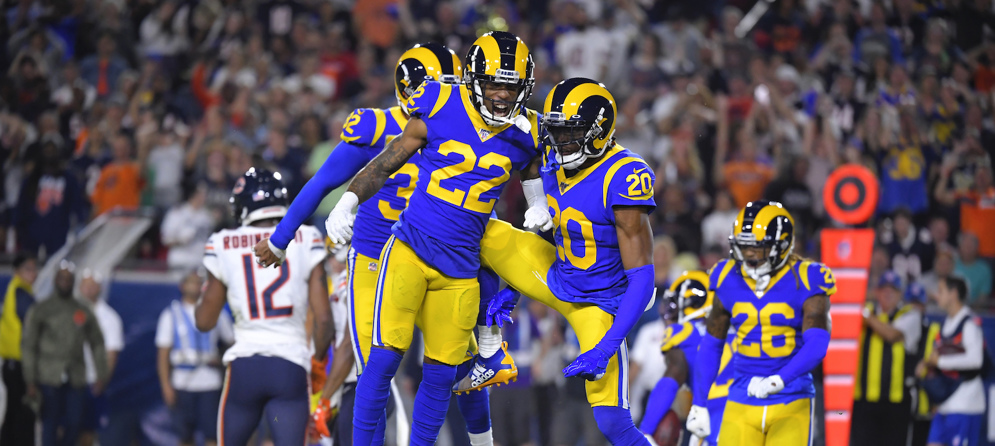
More than ever, NFL offenses are staying on the field on fourth down. In the 2019 season, the rates with which teams have gone for it on both fourth-and-1 and fourth-and-2 plays are higher than in any season during the last two decades.
To answer the question of when teams are going for it — even after knowing the distance needed for a first down — we need additional information. Where on the field is the team? What is the score? How much time is left?
Using statistical modeling, we estimated the likelihood that a team would go for it on fourth down — given distance, score, yard line, and time remaining — for each of the last 15 regular seasons. Here’s a plot that compares the likelihood that a team will go for it in 2019, relative to the average from the 2005—2018 seasons, shown across the length of the field (left to right). The plot assumes that the game is tied at the start of the second quarter, when the increase in fourth-down aggressiveness has picked up the most. Each line corresponds to a different distance category.

The uptick in fourth-and-1 aggressiveness has primarily happened in two scenarios — when an offense is around midfield and once an offense has fewer than 10 yards to go for a touchdown. Increases in all other go-for-it rates are primarily centered around the opponent’s 40-yard line. As an example, teams at the opposing 40-yard line when facing a fourth-and-2 are going for it 25.1% more often in 2019 relative to past seasons.
As additional anecdotes, in 2019 here are the seven fourth-down attempts where a team would’ve gone for it less than five percent of the time.
- Baltimore successfully went for it on fourth-and-3 at the Kansas City 9-yard line during Week 3. The game was tied with five minutes left in the first quarter. Go for it probability: 2.9%
- Minnesota successfully went for it on fourth-and-4 at its own 31-yard line during Week 4 against Chicago. The Vikings were trailing by 16 with two minutes left in the third quarter. Go for it probability: 3.1%
- New England unsuccessfully went for it on fourth-and-7 at the Kansas City 27-yard line during Week 14. The Patriots were trailing by 10 with seven minutes left in the second quarter. Go for it probability: 3.1%
- Los Angeles Chargers unsuccessfully went for it on fourth-and-goal from the Minnesota 15-yard line during Week 15. The Chargers were down 15 points at the start of the fourth quarter. Go for it probability: 3.3%
- Chicago unsuccessfully went for it on fourth-and-9 at the Los Angeles Rams' 31-yard line during Week 11. The game was tied with nine minutes left in the first quarter. Go for it probability: 3.8%
- Baltimore successfully went for it on fourth-and-1 at its own 29-yard line during Week 15 against the New York Jets. The Ravens were up 21 points with two minutes left in the third quarter. Go for it probability: 4.1%
- Buffalo unsuccessfully went for it on fourth-and-10 at the Philadelphia 29-yard line during Week 8. The Bills were down 11 points with one minute left in the third quarter. Go for it probability: 4.9%
The most conservative decision according to our model? During Week 1, the Pittsburgh Steelers chose to kick a field goal on a fourth-and-goal from the New England one-yard line, when trailing by 20 points. Our model estimates that a typical team would have gone for it 95.2% of the time.
Teams Taking More Time Off Play Clock in 10-minute OTs
December 19, 2019
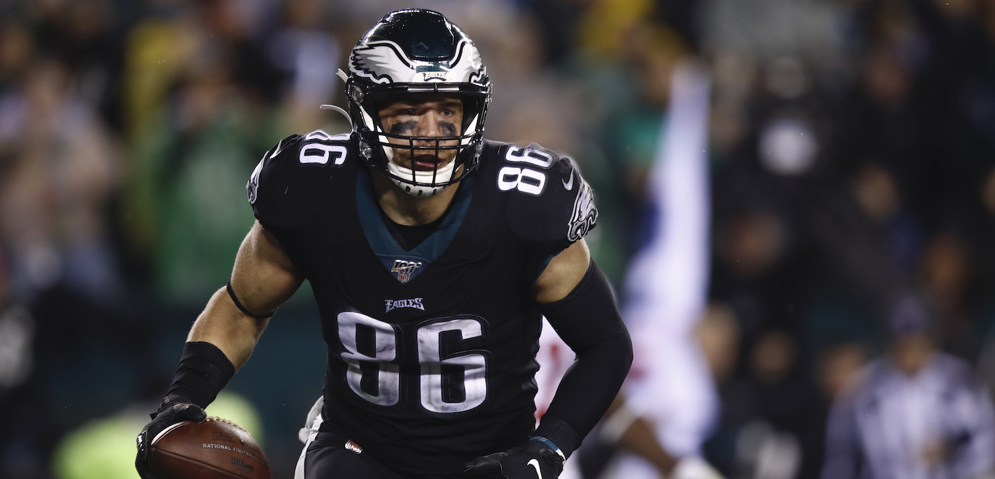
After receiving the ball to start overtime Week 14 against the New York Giants, the Philadelphia Eagles drove down the field and scored a touchdown. The drive was quick — Philadelphia took only eight plays to go 75 yards — however, the Eagles used almost as much of the 10-minute overtime as they could.
Philadelphia’s eight plays took nearly five minutes off the game clock, with the Eagles snapping the ball with seven, nine, five, two, three, one, and five seconds left on the play clock on their last seven plays, all of which took place with a running clock. Over the past decade, fewer than one in 35 touchdown drives of similar length and number of plays have taken so much time off the clock.
Although just one example, Philadelphia’s lack of urgency to start overtime reflects an interesting league-wide trend that seems to have appeared over the last three seasons — since the NFL switched from a 15-minute to a 10-minute overtime period, when teams get the ball to start overtime, they take more time off the play clock.
Here’s a beeswarm plot that shows the amount of time left on the play clock for every regular-season, first-possession overtime play, comparing the 15-minute overtime (2010 – 2016) to the 10-minute session (2017 – Week 14 of 2019). Only plays with a running clock are shown.

With the shorter OT, teams are snapping the ball an average of 2.2 seconds later in the play clock. In the plot, the red dots are slightly shifted to the left relative to the blue dots. For example, 32.5% of plays started with a running clock are started with less than five seconds on the play clock, compared to 17.5% of plays played with a 15-minute overtime.
There are multiple reasons for snapping the ball later in the play clock, but offenses seem to be recognizing that if they take more time off the clock and don’t score a touchdown, they leave their opponent less time to tie or win the game. Interestingly, a related trend has appeared on the very first play of overtime — teams are passing less often. In games played with 15-minute overtimes, the first play of the first possession was a run 38.2% of the time (34 of 89). In games with 10-minute OTs, the first play has been a run 56.8% of the time (21 of 37). This uptick in run plays comes despite the league as whole passing more often on first down in other game situations.
Win Probability Models for Every NFL Team in 2019
December 11, 2019
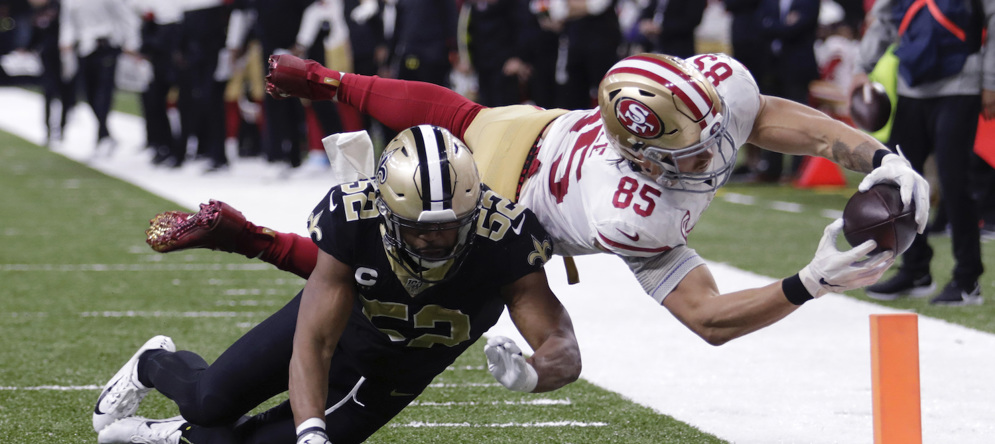
In Football Operations, one of our primary roles as a data and analytics team is to supply the league with metrics that help us better understand the game. One framework that we often use is win probability.
Models to estimate win probability have been around football for more than a decade, with several researchers (including Brian Burke, Trey Causey, and a trio of statisticians from Carnegie Mellon) having developed versions of their own. These models help assess each team’s chance of winning at any given point in a game.
Models use familiar inputs including score, down, distance, and field position, and also more subtle variables, including which team kicked off to start the game and the number of timeouts each team has left. During the 2019 offseason, win probability models were used by the National Football League’s Competition Committee to assess which penalty types have the biggest impact on game outcomes. In addition to penalties, we can use win probability formulas to derive metrics of game competitiveness and excitement.
The following chart highlight’s each team’s win probability curve through every game of the 2019 season (shown in gray), as well as an average win probability curve (shown for each team in its primary team color).

To find the teams that have played in the most exciting games, look for the grey curves with the biggest swings. Detroit, Indianapolis, Seattle and Tampa Bay have each averaged more than seven exciting plays per game — defined as those with at least a 10% swing in win probability — and their curves reflect that many games aren’t decided until the fourth quarter, when big swings in win probability tend to happen. Alternatively, most New England, Washington and Baltimore contests have been decided by the start of the fourth quarter and each of those teams averages fewer than four exciting plays per game.
We can also split into different time segments. On a per-quarter basis, no one has been better than Baltimore in the first quarter. The Ravens have typically started the second quarter with a 68% win probability, which implies that they earned an average of +18% in win probability per-game in the first quarter alone. Kansas City has dominated the second quarter (+17% per-game), Chicago has controlled the third quarter (+14%), and Green Bay has closed out games in the fourth quarter (+15%).
Which were the most exciting games of the 2019 season?
The Week 10 (link) Arizona and Tampa Bay game and the Week 5 (link) Rams at Seahawks game are tied as the most back and forth games, with the Week 14 thriller between San Francisco and New Orleans (link) right behind. And although it wasn’t as high scoring as those previous contests across the entirety of the game, Chicago’s win in Week 2 over Denver featured a flurry of changes near the end. In the final two minutes, there were five plays — a Denver fourth down conversion, Denver touchdown, Denver two-point conversion, Chicago completion into field goal territory, and a Chicago game-winning field goal — that swung each team’s chance of winning the game by at least 25%; no game to date has had more than three such plays.
Where’s the best spot on the field to complete passes… and not get picked off?
December 5, 2019
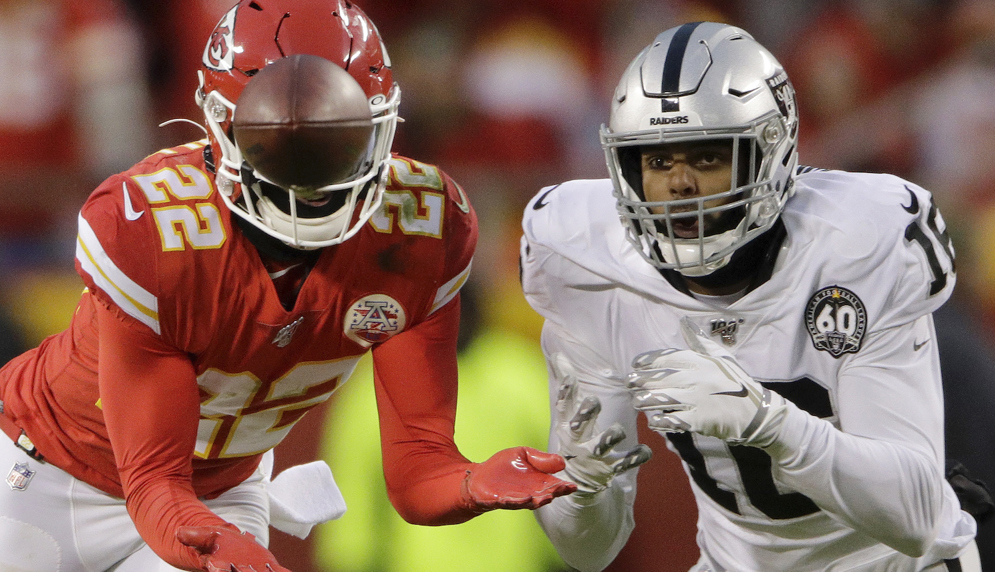
In analytics circles, the middle of the field is generally considered to be the best place to throw if you want your receiver to catch the football. But a quarterback’s job goes way beyond completing passes. A QB also has to read the defense, avoid pressure and sacks, prevent interceptions and pick up first downs.
Turns out, not only is the middle of the field the best place for a receiver to catch a pass, it’s also the best place for an opponent to intercept a ball, too.
The following plots look at the likelihood of a completion (left plot) and an interception (right plot) based on the pass distance (in yards) and direction (left, middle, right). Regular season games from 2010 through Week 13 of 2019 are included (bin sizes with smaller samples are dropped).
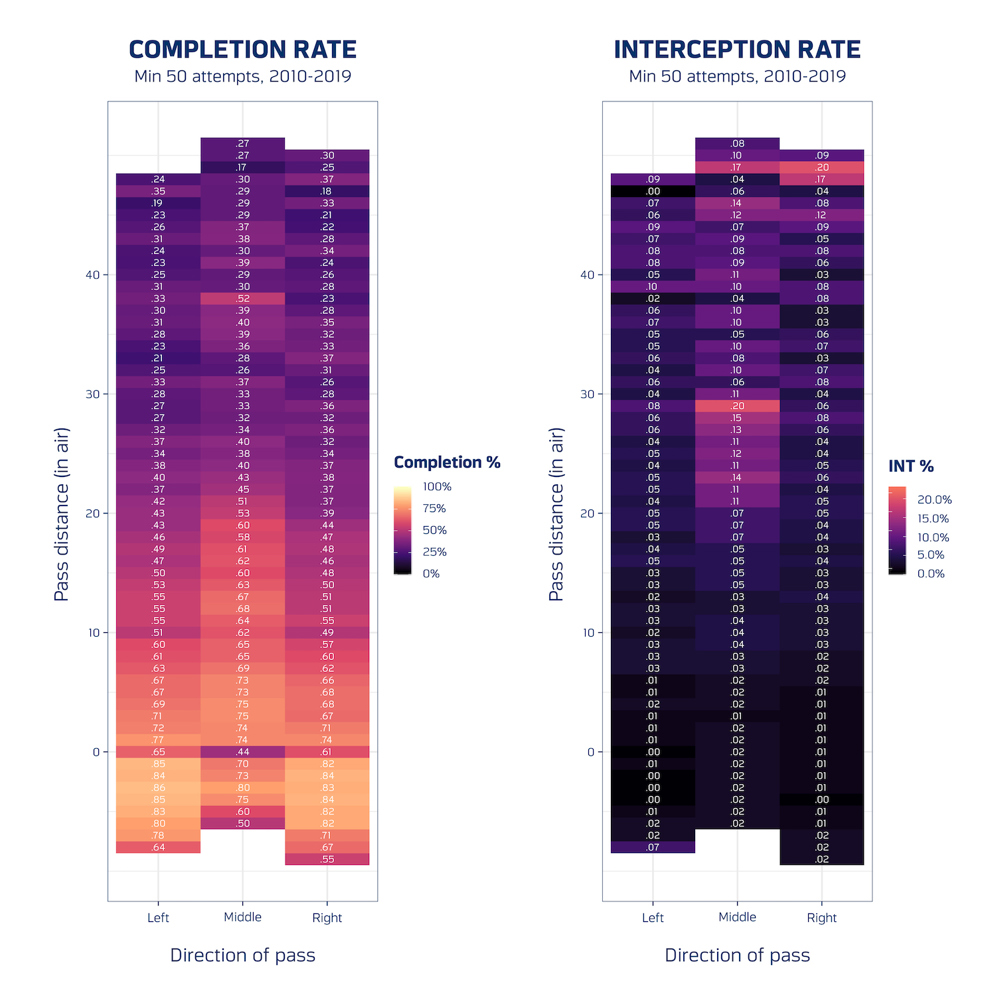
In both plots, lighter colored areas correspond to more completions or more interceptions. Both middle columns feature lighter colors when compared to the columns on the left and right. That implies that throwing down the middle yields higher rates of completions, but it also yields higher rates of interceptions.
More specifically, a pass thrown 20 yards down the middle of the field has about the same completion percentage as one thrown 10 yards towards either sideline. But those same passes thrown down the middle of the field are also about four times as likely to be picked off. Alternatively, nearly one in five passes are picked off when the ball is thrown 30 yards down the middle of the field, which is about three times the rate of interceptions on the sideline.
As more years of tracking data are observed, we’ll be able to more precisely identify the best parts of the field to complete passes (Ex: Where your favorite team likes to throw the ball), as opposed to relying on play-by-play categorizations. For now, know that when a pass is thrown to the middle of the field, it’s less likely to be incomplete.
Frank Gore Keeps on Running
November 27, 2019
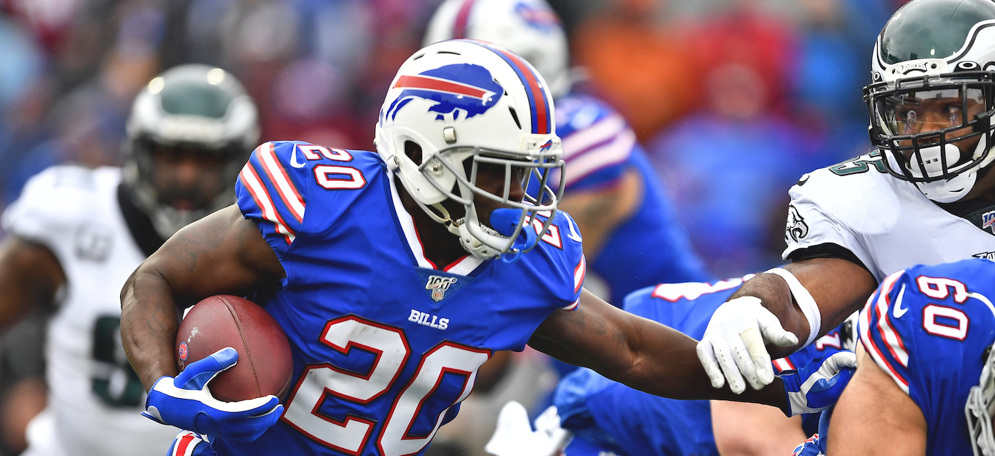
Over the last two decades, the median age of running backs has dropped two full years, from 26 years, 7 months (in 2000) to 24 years, 7 months (2019).
Meanwhile, Frank Gore, at the age of 36, just keeps on running.
Check out the following chart, which highlights the age distribution of ball carriers in each season with at least 150 carries (or 100, in 2019). Player ages are shown as of September 1 in each season. While the curves have moved slowly left over time, the trend of getting younger holds for all but one player — Gore.
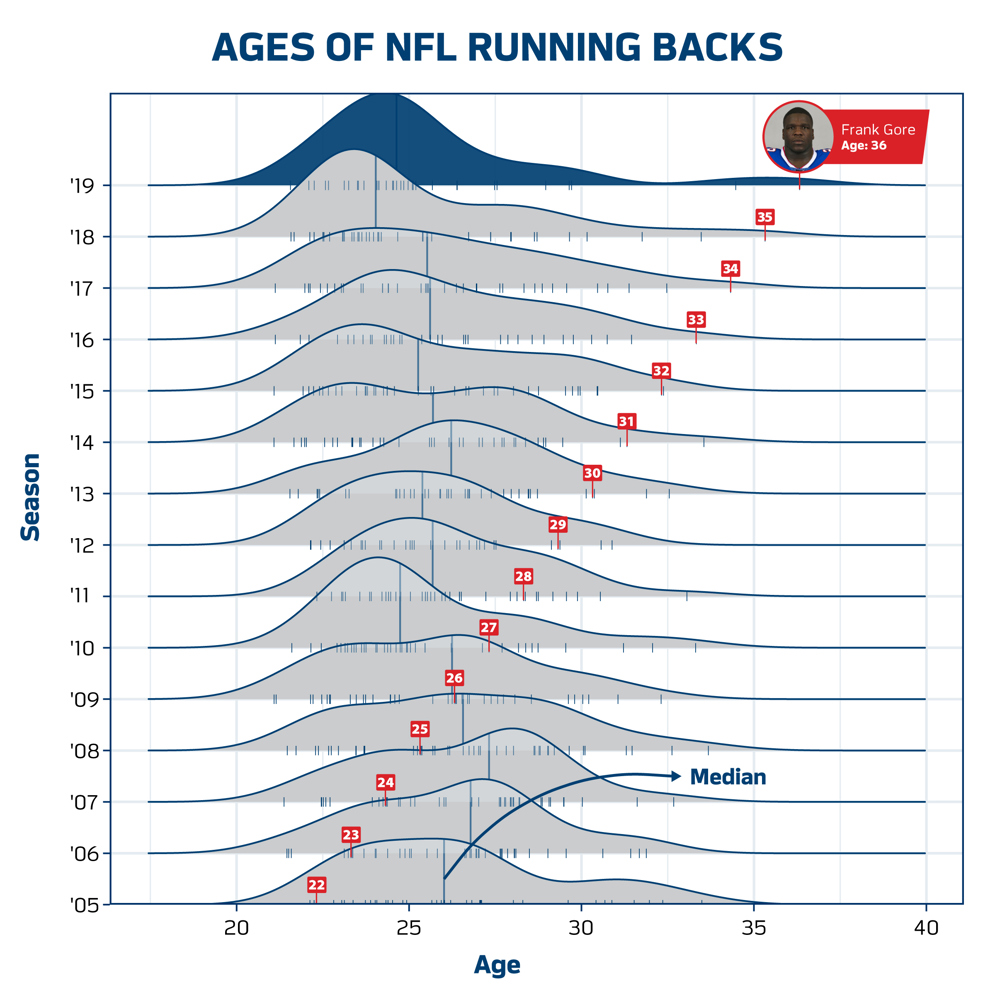
Initially drafted in 2005 by the San Francisco 49ers, Gore was the third youngest running back in his rookie season, when he logged 127 carries for 608 yards. He’s topped 125 carries in each season since. In contrast, of the 20 running backs that were likewise drafted in 2005 with Gore, only one — Darren Sproles — recorded a single rush after the 2014 season.
Over the last four seasons, Gore has finished as the oldest back with at least 125 carries. It’s no surprise that with Gore being so productive for so long, his place on the NFL’s all-time rushing list is secure; this past weekend, Gore passed Barry Sanders for No. 3 on the NFL’s career rushing leaderboard.
Aaron Rodgers Takes Advantage of Free Plays Better Than Anyone
November 21, 2019
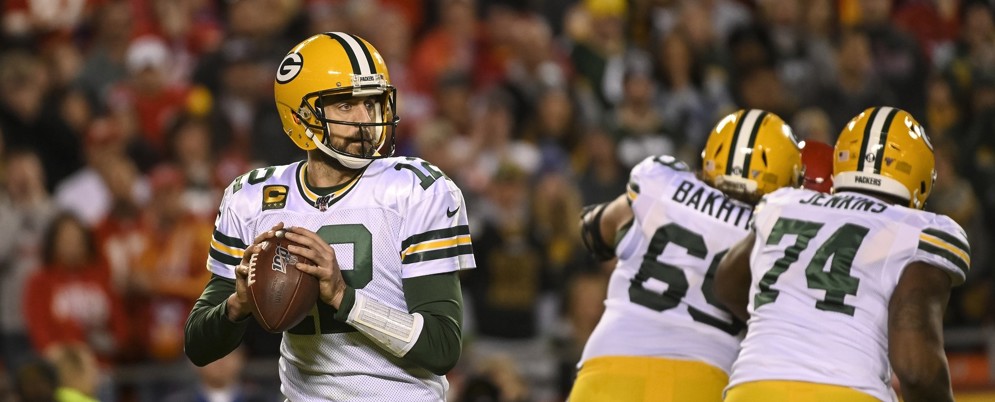
Aaron Rodgers is the NFL’s career leader in passer rating, a two-time MVP and seven-time Pro Bowler. But there’s one thing he’s even better at than passing the ball — taking advantage of the “free play.”
As the quarterback is calling signals, an early jump by a defensive player is a five-yard defensive offside penalty. If the center snaps the ball before that defensive player is a threat, the offense can still run a play. This instance is called a "free play" because even under the worst-case scenario — say, an interception — an offense can still go back and take the initial five-yard penalty.
Since 2006, Rodgers leads all quarterbacks with 84 passes thrown on free plays. And no one has attempted more deep free shots than Rodgers, either. Check out the plot below, which highlights the air yards each quarterback has thrown for after drawing an offside penalty from the defense.
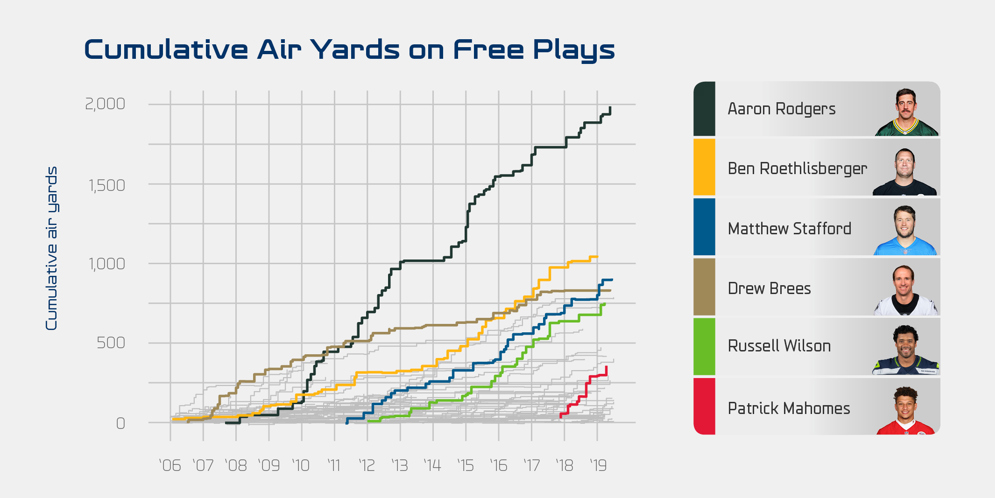
Each of the 170 quarterbacks with at least one free play in his career is shown in the plot with the grey lines, with six standout quarterbacks highlighted.
Rodgers stands alone. Beginning in 2010, he has thrown for approximately 225 air yards a season on offside calls alone. More precisely, roughly once every other game Rodgers earned a free shot downfield, averaging 25 air yards on these throws. No quarterback is within 900 yards of Rodgers in total on this stat since 2006.
Rodgers owns the top three individual seasons in air yards on free plays, peaking in 2015, when he attempted 16 passes for a total of 407 yards downfield (25.4 air yards per free play). Of those 16, seven were complete, including two touchdown passes to James Jones.
“Free play — Rodgers has made a living on this,” said ESPN’s then-Monday Night Football announcer Mike Tirico when calling one of Jones’ touchdown grabs in 2015 (video below). “Draw the offside, know it’s a free play, take the shot downfield.”
While Rodgers has owned air yards on free plays over the last decade, one young quarterback has started on a blazing path — Kansas City Chiefs signal caller Patrick Mahomes. In 2018, Mahomes tossed 15 passes after getting a free play, completing nine, and throwing the ball a total of 234 yards downfield.
Which quarterbacks have been the least aggressive off of an offside call?
Current Minnesota Vikings quarterback Kirk Cousins has thrown just 13 career passes off a free play, which traveled a total distance of 87 yards downfield (6.7 air yards per free play). Deshaun Watson (six passes, 56 air yards, or 9.3 air yards per free play), Kurt Warner (12 passes, 48 air yards, 4.0 air yards per free play) and even Peyton Manning (17 passes, 121 air yards, 7.1 air yards per free play) stand out as the opposites of Rodgers.
How Do NFL Coaches Use Their Challenges?
November 14, 2019
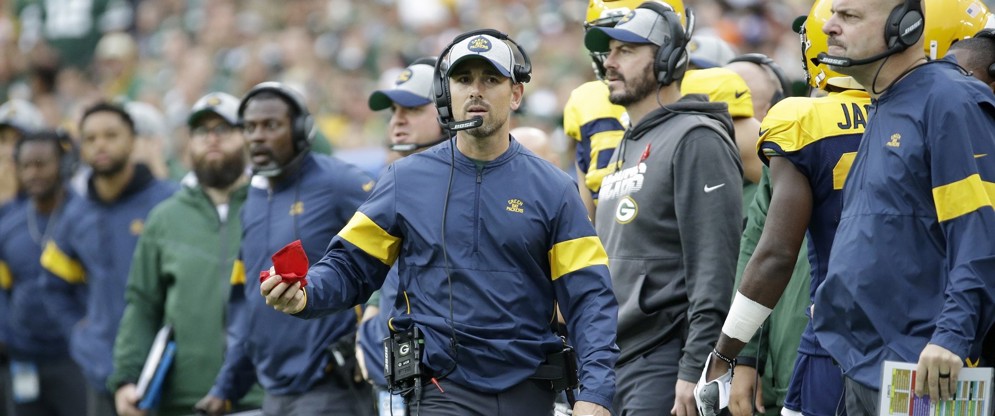
After an unsuccessful challenge of an incomplete pass on Thursday Night Football against the Los Angeles Chargers, Oakland Raiders head coach Jon Gruden fell to 0-for-7 on challenges in the 2019 regular season. But Gruden is not the only one with limited success — through Week 10, 13 of the league’s 32 head coaches have yet to win a coaches’ challenge this season.
With that in mind, here’s a chart showing how frequently coaches throw a challenge flag (x-axis) versus how successful they are on those challenges (y-axis). The data shows all games for each coach dating to 2004, the first year in which the league allowed up to three successful challenges per team.
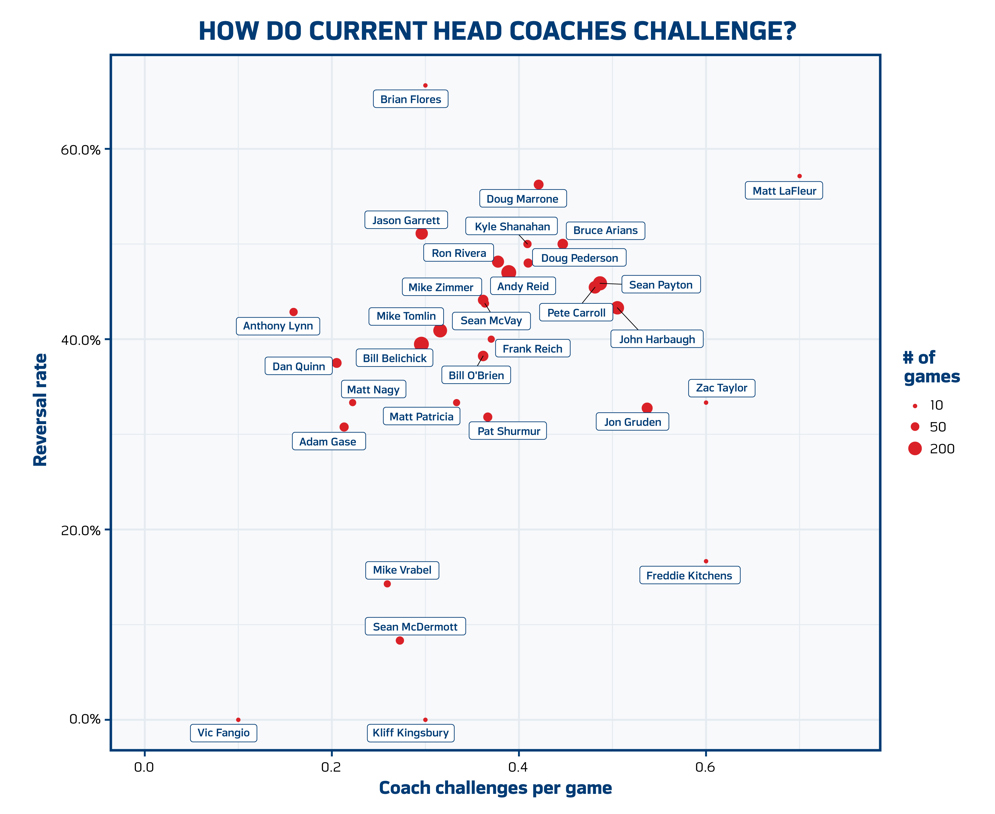
In the top right of the graph, Green Bay Packers head coach Matt LaFleur has been the most frequent/successful challenger (winning four of seven challenges), though that has come with only ten games worth of data. More robustly, John Harbaugh, Sean Payton, Bruce Arians, Pete Carroll and Doug Marrone stand out as coaches with multiple seasons under their belts who frequently, but relatively accurately, use coaches’ challenges.
Alternatively, among coaches with at least half a challenge per game, only Freddie Kitchens of the Cleveland Browns has yielded a lower success rate than Gruden. And in the top left, Jason Garrett of the Dallas Cowboys boasts a low challenge frequency (0.29 per game), but when he has challenged, he has successfully overturned the decision on the field more than 50 percent of the time (23-for-45).
Among non-active coaches, and using games after 2004, count former Seattle coach Mike Holmgren as one of the most passive challengers (0.28 per game), with Mike Shanahan of the Denver Broncos (0.52 per game) on the more aggressive side. Meanwhile, Jim Caldwell (Indianapolis Colts) won 63 percent of his challenges, compared to 27 percent for Norv Turner.
Visualizing the Special Teams Gunner
October 29, 2019
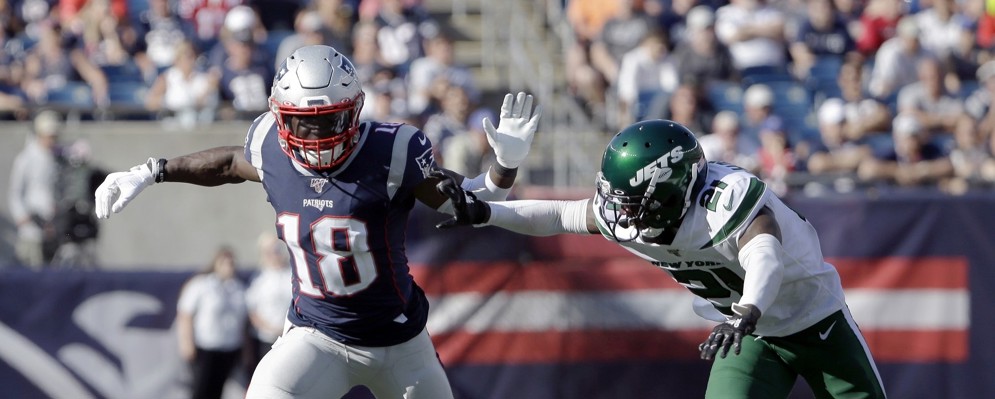
NFL special teams players may not be household names, but they play a valuable role in their team’s success. One key special teams player is the punt-team “gunner” – a player who lines up near the sideline, with the goal of moving downfield as fast as possible to eventually tackle the punt returner. The main challenge of being a gunner – there’s usually at least one defender in your way.
"You're trying to beat two guys in what amounts to a running street fight at a sprint,” said Steve Tasker, to Esquire Magazine. Tasker would know – as a seven-time Pro Bowler and five-time first-team All-Pro, he’s considered one of the best gunners in NFL history.
Though it’s difficult to highlight Tasker’s effectiveness today without the help of video, we can use Next Gen Stats to compare and contrast how today’s gunners operate.
For example, we took the player from each team who has played the gunner role most often for his team in 2019 (Weeks 1 to 7). Below is each player's path, standardized so that they are starting at the same line of scrimmage (moving from the bottom of the image to the top), and using only punts in which each gunner was defended by one player only. Players are arranged in order by who covered the most vertical distance on their coverages in the first 4.5 seconds after the punt, with Justin Bethel (formerly with the Baltimore Ravens, now with the New England Patriots) traveling the furthest in the top left, and George Odom (Indianapolis Colts) traveling the shortest in the bottom right.
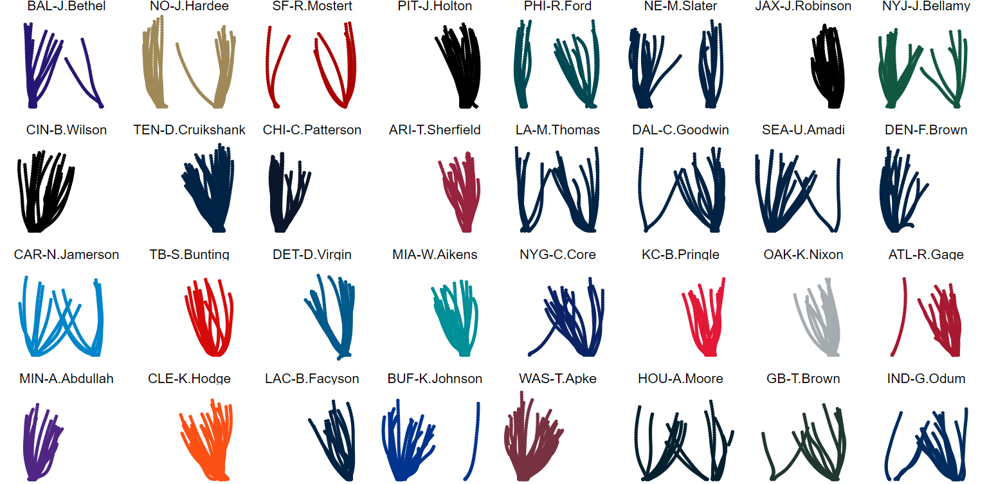
One aspect that stands out is how while some gunners only line up on certain sides (Ameer Abdullah on the Minnesota Vikings favors the offense’s left side, while the Cleveland Browns’ KhaDarel Hodge lines up on the right, for example), others like New England’s Matthew Slater are equally likely to line up on either side. In the chart, the typical gunner appears on about 25 punt plays.
Although tough to determine in the chart, the effectiveness of certain gunners in moving downfield is interesting. Players in the top row, for example, are about 28 yards downfield, roughly six yards further ahead than players in the bottom row.
Finally, with Bethel recently signing with the Patriots, New England now boasts two of the league’s fastest gunners (Slater is a seven-time Pro Bowler).
Other interesting gunner tidbits?
- Matthew Slater, Josh Bellamy (New York Jets) and Brandon Wilson (Cincinnati Bengals) each have been double teamed by defenders 15 times, leading the league.
- Against single defenders, no one travels quicker in the play's first two seconds than Johnny Holton Jr. of the Pittsburgh Steelers. At that point, Holton is an average of 7.7 yards downfield, typically about 0.4 yards in front of the next fastest gunner at that point (Slater).
- When facing two defenders, Dee Virgin (Detroit Lions) and Trenton Cannon (New York Jets) are the only two gunners to average being at least 20 yards downfield at the 4.5-second mark after a snap.
- The Miami Dolphins lead the league in the rate with which they double team at least one gunner, doing so on 62 percent of punts. Alternatively, the New Orleans Saints put two defenders on a gunner on only 20 percent of opponent punts.
What Numbers Tell Us About Preseason Play Time
October 23, 2019
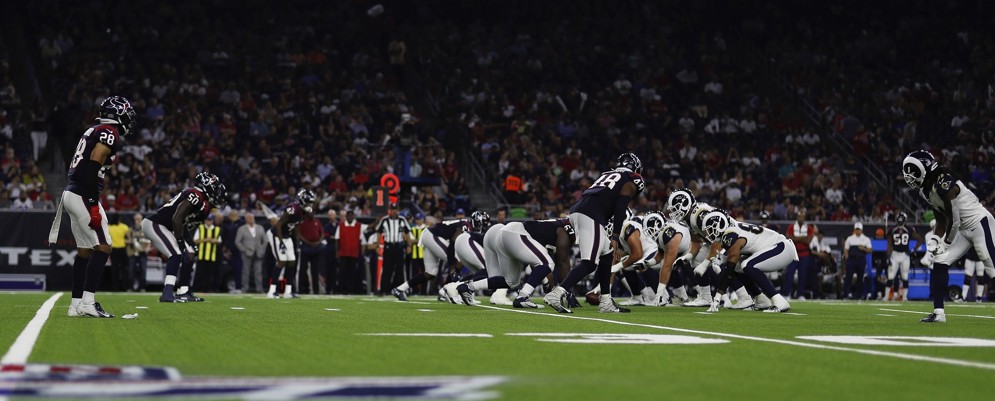
One aspect of football that has recently been a point of discussion is the role of preseason games. As of the 1978 season, teams have almost always played four preseason games in each season.
To assess how preseason games may have changed over the past decade or so, our Football Operations data and analytics group analyzed team behavior dealing with the playtime of players who started for their teams during Week 1 of the regular season. When looking at this group of eventual starters, how often did they play in each of the four preseason weeks?
The following chart shows the percent of possible snaps for Week 1 starters in each week of the preseason, as well as Week 1 of the regular season. Averaged across all positions, starters typically play about 80-85 percent of the available snaps in a regular season game, a rate which has mostly stayed consistent over time. This is important, as it suggests that any drop in playtime is not due to coaches using player rotations more often.
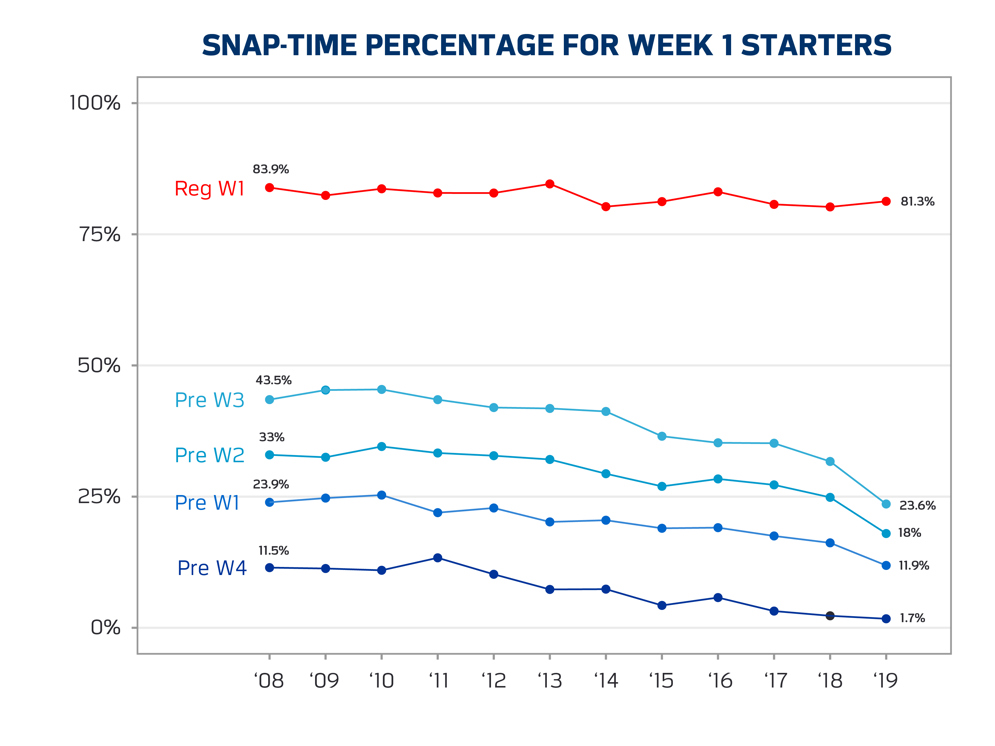
Alternatively, playtime in preseason games for Week 1 starters has dropped substantially over the last decade. In the figure, the lines in blue have been trending downwards for several years, reaching all-time lows for playtime in 2019.
Some facts that stood out:
- Among preseason Week 3 games (abbreviated as Pre W3 in the chart), Week 1 starters played nearly 50 percent of available snaps in 2010. In 2019, Week 1 starters played 23.6 percent of available snaps.
- Week 1 starters only played 1.7 percent of available snaps in preseason Week 4 games in 2019.
- The year-over-year drop in preseason participation of Week 1 starters was larger this past year (2019 vs. 2018) than in any previous period over the last decade.
- In 2019, there were 85 regular season Week 1 starters that did not play a single snap during the preseason. From 2008 to 2018, the league averaged 24 such players per season.
Altogether, snap time percentages among Week 1 starters dropped to new lows in 2019, information that is valuable as the league assesses the role of preseason games in the context of the larger framework of NFL scheduling.
Where Do Ball Carriers Tend to Move?
October 15, 2019
Where do ball carriers tend to move?
The primary theme of the NFL’s second Big Data Bowl, a competition that crowdsources analytical insight into football data, is to predict performance on rush plays. From the moment a ball carrier takes a handoff, where will he end up?
As part of the contest, participants receive snapshots of Next Gen Stats player tracking data from every 2017 and 2018 handoff play. This data includes the speed, angle and direction in which each of the 22 players on the field were moving. One potential input for competitors to consider using in their predictions is the angle in which the ball carrier was moving when he got the ball. As an example, players moving towards the sideline may simultaneously be more likely to be stuffed for a loss and to pick up big yardage (if, for example, he were to outrun defenders).
One cool plot that can be made from the data (see the statistical code for yourself) is a sonar chart. Initially popularized in soccer by Eliot McKinley, sonars allow us to identify the angles that players tend to move. With ball carriers, the size of each sonar band corresponds to the frequency with which ball carriers are moving in each binned direction group, and the color reflects how successful they are with the ball. Success rate is determined by down and distance (e.g., a three-yard run play on first-and-10 is not a success, while it is a success on third-and-two).
Here’s a sonar for each player who led his team in carries during the 2017 and 2018 regular seasons. Bands are pointing up, corresponding to players moving from the bottom of the screen to the top, and consist of data from each the past two seasons.
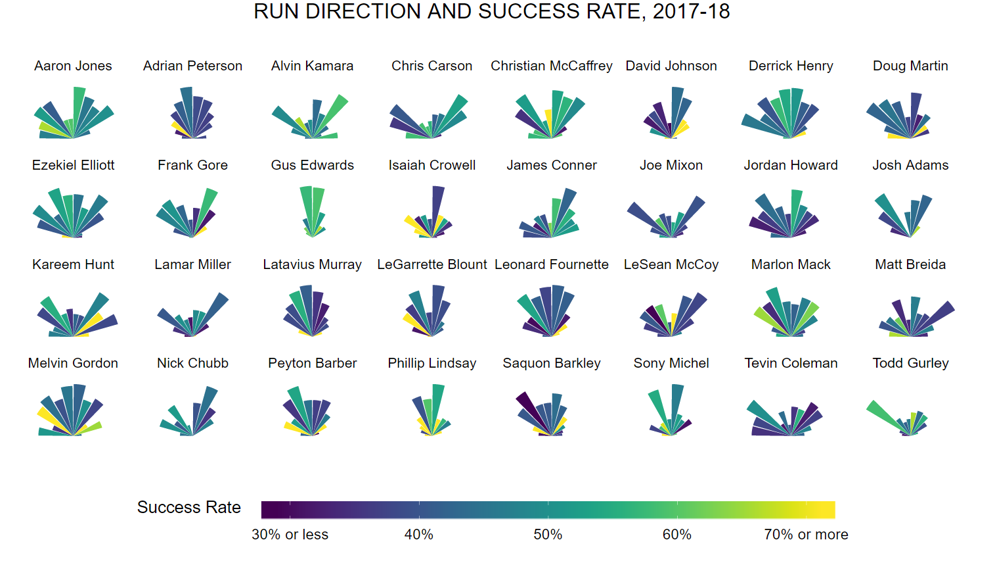
Compare the sonars of Gus Edwards (Baltimore Ravens) and Alvin Kamara (New Orleans Saints). Both boast success rates around 60%, but Edwards did most of his damage up the middle, while Kamara tended to get the ball off-tackle. Alternatively, as you’ll see near the bottom right of the chart, then-Atlanta Falcons running back Tevin Coleman (outside runs) and New England Patriots back Sony Michel (up the middle) also offer a nice contrast.
Information provided in sonars is just one of the many features available for Big Data Bowl contestants to use as they develop their algorithms. Stay tuned for the end of the 2019 regular season, where a live leaderboard will help determine the most accurate predictor of ball carrier success — and the Big Data Bowl title that comes with it.
A Conversation with Two Big Data Bowl Finalists
October 10, 2019
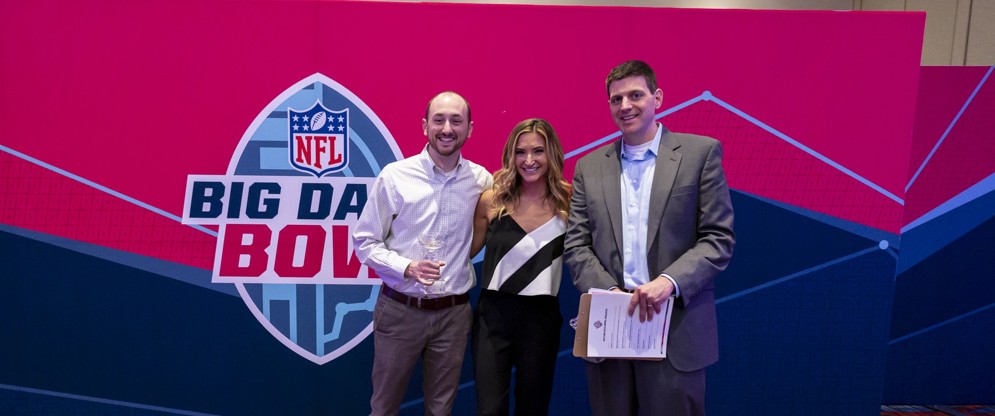
The 2020 Big Data Bowl is here! And to help mark the occasion, we’re flashing back to the inaugural event to chat with two finalists from the 2019 contest – Nathan Sterken and Adam Vonder Haar. Both contestants earned a trip to the NFL Scouting Combine to present their reports, with Nathan taking home the open entry grand prize and Adam being a finalist.
In addition to their success at the Big Data Bowl, they both also earned new jobs in football analytics following the competition – Adam with the Dallas Cowboys, and Nathan with Telemetry. We spoke with them about their reports, memories from presenting at the Combine and their new roles.
Michael Lopez (Director of Football Data and Analytics, NFL): Tell us a bit about your background in analytics and football.
Nathan: I've always loved football. My playing career peaked in fourth grade so my football background is as a fan. I grew up near Ann Arbor so the University of Michigan is my favorite team. I've been doing analytics professionally for over 10 years in a few industries — from analyzing employment data at the Labor Department to polling and TV data with political campaigns and online behavior with technology companies.
Read Nathan's winning report - RouteNet: a convolutional neural network for classifying routes
Adam: My interest in analytics and football began about five years ago, around the same time DraftKings and FanDuel were becoming more popular as an alternative to traditional redraft fantasy leagues. I had always enjoyed playing fantasy football with my friends growing up, but it wasn't until I got interested in doing daily fantasy more seriously that I forced myself to learn to code because the copying and pasting into Excel wasn't cutting it anymore. At some point, what was initially a means to an end in coding became what I enjoyed the most, and the analysis became more interesting to me than my results in fantasy football.
Michael: Why did you enter last year’s Big Data Bowl?
Nathan: Lots of reasons. I'd wanted to get my hands on the NFL player tracking data ever since reading about it; I was interested by the research prompt I answered (identify the best receiver routes), since I’d never seen any large-scale analysis of that topic; and since the finals were at the Combine, I figured this was my best shot at getting to run the 40 (and to meet people working in this space).
Adam: The biggest reason I entered last year’s Big Data Bowl was pure curiosity about the data and excitement about the process of working with this new data. Working with tracking data is difficult, and if you don’t enjoy the process at least a little bit, it’s easy to give up on it. I also saw it somewhat as a challenge to myself and as a learning opportunity to improve my skill set. Lastly, there was definitely some motivation around potentially going to the Combine and getting my work in front of teams, but both of those felt like such a long shot to me that I couldn’t rely on them for my main motivation.
Read Adam's report - Exploratory data analysis of passing plays using NFL tracking data
Michael: Give us your one paragraph elevator pitch — what was your entry about last year?
Nathan: I demonstrated that you can automate some of the classification work that is typically done by hand and then analyze plays at scale — specifically, I trained a computer to recognize receiver routes using the player tracking data and then computed efficiency metrics for route combinations. The finding: throw it deep (or at least threaten to).
Adam: My entry last year was centered around exploring several potential techniques to discover how an offense can get receivers more open. I used several different methods to classify receiver routes, looked at how different combinations of routes result in greater separation for receivers, and used convex hulls to characterize defender spacing.
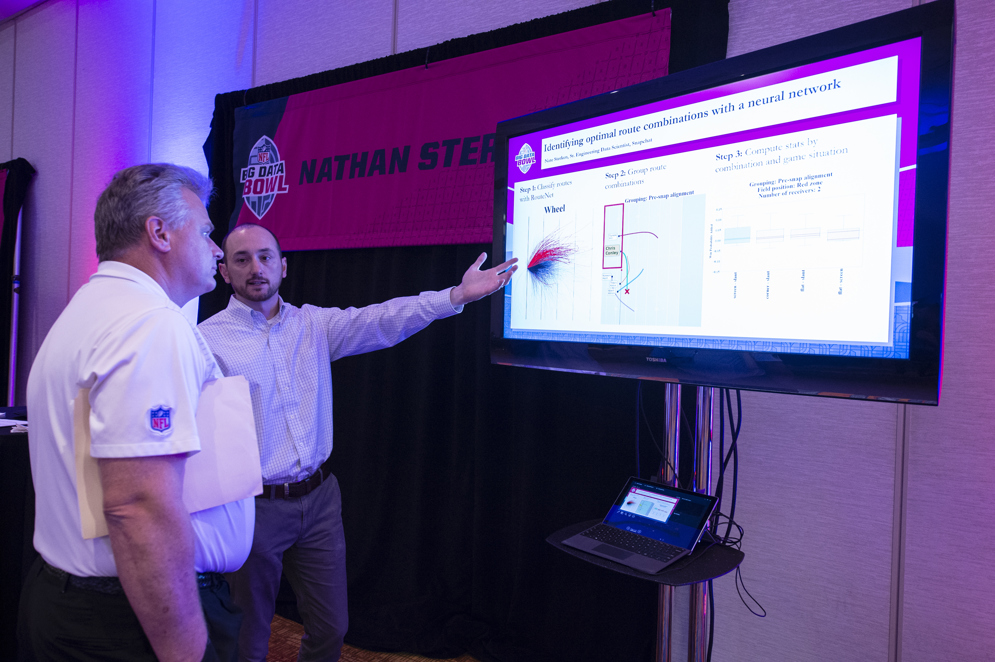
Nathan Sterken walks through his winning report at the 2019 Big Data Bowl.
Michael: What is one memory of the event that stands out as you look back?
Nathan: Seeing head coaches in the hallways was fun, but the stand-out moment was discussing my research with the analytics staff from several clubs and the other folks who attended the event. I made connections with several clubs and got to meet a couple of the authors I cited in my paper.
Adam: One of my favorite memories of last year’s event was meeting the many brilliant, like-minded individuals who also submitted entries. Being able to talk football and football analytics specifically in-depth, listening to novel ideas everyone had, and, in general, just hanging out with each other at the Combine made the experience especially memorable.
Michael: Next Gen Stats can be tricky. What would your recommendation be for a first-timer dealing with NFL player tracking data?
Nathan: Football coaches have the best advice here: take it one play at a time. If you start by focusing on one play (preferably one where you can find video for it so you know exactly what happened) and doing some simple plots and statistics, you can get your arms around the format of the data without worrying about the size of the overall data set. That said, you’ll want to do that exploration in a programming language like Python or R because you’ll need to be able to quickly scale up your analysis to crunch through each play.

Adam Vonder Harr discusses his report, Exploratory data analysis of passing plays using NFL tracking data.
Adam: As tempting as it can be to dive into analysis immediately, I think it’s important to take your time cleaning and understanding the data as much as possible first. The tracking data is not without anomalies and errors occasionally, and even the good data often must be modified so that everything is oriented and normalized consistently. Spending the effort to prepare the data thoroughly makes the analysis much easier when you get to that point.
Michael: Tell us a bit about your new roles with Telemetry and the Dallas Cowboys, respectively. How have you been able to help?
Nathan: Telemetry helps clubs with game preparation and player analysis by making it quick and easy to find video of any type of play by any player. Specifically, they use the player tracking data to create a rich set of annotations on each play and then pair that with a searchable video database. I’ve helped them by building modeling pipelines that use the player tracking data to identify additional aspects of the play, like the type of coverage that was played by the defense.
Adam: I am now a Football Research Analyst with the Dallas Cowboys. Our team’s responsibilities range from scouting and personnel, to assisting coaches with game planning and opponent scouting, to sports science and player health. I spend a lot of time working with the tracking data specifically, trying to discover ways we can use it to make our processes more efficient and improve our ability to make evidence-based decisions.
What Can Player Tracking Data Tell Us About the Onside Kick?
October 2, 2019
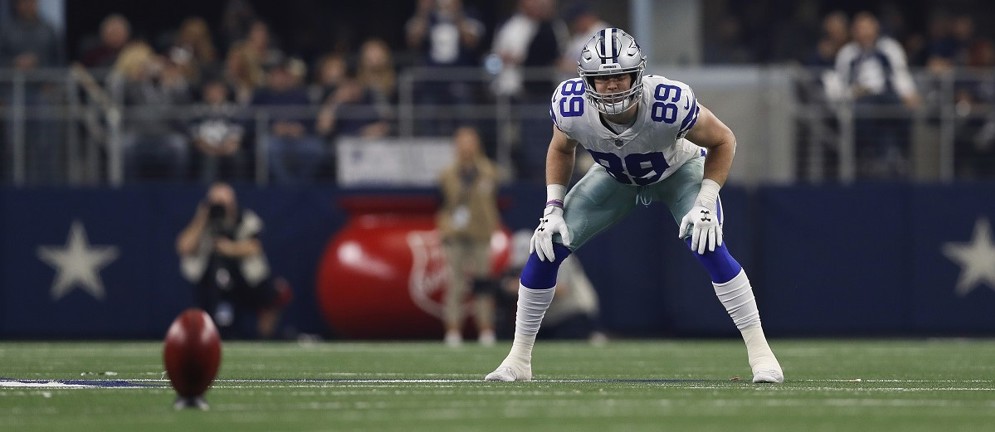
Throughout NFL history, it wasn’t uncommon for kickoff teams to line up like they were kicking deep, only to shock both fans and opponents with an onside attempt. Famously, Thomas Morstead of the New Orleans Saints surprised the Indianapolis Colts at the start of the second half of Super Bowl XLIV with an onside kick (one that the Saints recovered). In total, from the start of the 2010 season through the 2017 season, the league averaged 9.4 surprise onside attempts per season.
In 2018, however, there were only five surprise attempts. Through the first four weeks of 2019, we’ve only seen one.
The likely culprit? Changes to the NFL’s kickoff rules.
Prior to the 2018 season, NFL Player Health and Safety and special teams coaches worked together to reimagine the kickoff play — one designed to increase player safety — resulting in a multitude of changes regarding player alignment and allowable blocking types. Concussions on kickoff plays dropped by 35 percent in 2018, but the formation redesign potentially made it more difficult to recover onside attempts. In addition to the drop in surprise onside kicks, the kickoff team has only recovered 6.1 percent of non-surprise attempts since the start of 2018, a rate lower than the league’s historical average of 12 percent. In 2019, teams are 0-for-9 at onside kick attempts through Week 4 (not including recoveries that were nullified by penalties).
During last year’s offseason meetings, the NFL’s Competition Committee debated the merits of a follow-up rule change, proposed by the Denver Broncos, that would have given teams the opportunity to use one scrimmage play per game in place of an onside kick. Although the proposal was not adopted, our football data and analytics crew was able to provide the Committee with insight into how and why onside kicks have changed.
Check out the below animation, which overlays Next Gen Stats tracking data on onside attempts for the kickoff teams and the football, averaged over the course of each of the 2017 (pre-kickoff changes) and 2018 seasons (post-changes). Dots in red correspond to players in 2017, while the blue dots represent players in 2018. Only onside attempts to the kickoff team’s right side are included.
Three differences stand out.
First, there are six red dots on the right side, compared to five blue dots. As part of the kickoff rule changes, five players must now line up on each side of the kicker.
Second, players on the kickoff team may no longer get a running start, which is why the blue dots (2018 season) begin the play standing still.
Finally, and perhaps most importantly, without the running start, players from the 2018 season are no longer able to get down the field as quickly, giving them less of an advantage over the receiving team.
Altogether, each of the above findings provide an explanation for why we are seeing fewer surprise onside kicks and lower recovery rates. Although Denver’s proposal for an alternative did not pass last year, the NFL will continue to use analytical insight to drive potential rules changes.
Q&A with 2019 Big Data Bowl College Winners
September 25, 2019
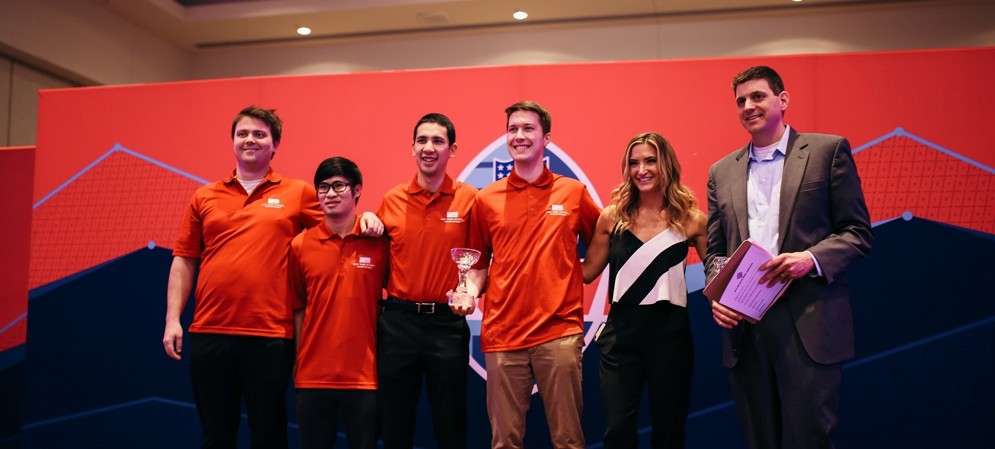
The first-ever Big Data Bowl brought together talented members of the analytics community – from college students to professionals – to crowdsource innovative and data-driven football ideas. For today’s Extra Point, we interviewed the college entry winners from Simon Fraser University – Matthew Reyers, Dani Chu, Lucas Wu and James Thomson – to hear more about their experiences and findings. The group’s first-place report, Routes to Success, modeled play success rate and expected points under various passing combinations.
Michael Lopez (Director of Football Data and Analytics, NFL): Tell us a bit about your background in analytics and football.
James: I’ve played football since high school, first as a defensive tackle and back, later in rec league flag football in college. It’s been my favorite game to play since I was 14. I got interested in sports statistics during my undergraduate degree in statistics, when I started following baseball more closely. I quickly turned to football, and since the beginning of my master’s in statistics, I have been active in football statistical research.
Dani: I’ve played sports my whole life, but my introduction to football was mainly through fantasy football. While I have played football in a casual setting, I have not played in an organized environment. I started statistical research in sports in 2016. I have a background in math, computer science and statistics.
Related: Read the group's winning report - Routes to Success
Matt: In elementary school, I thought I was going to be the next NFL star. It took all of five games to realize that wasn’t the case. I played for a few more games after that but stuck with other sports. When I eventually got to University, I stumbled across statistics and a group of people that liked sports as much as I did. Since that class four years ago, I have been applying statistics to as many sports problems as I can get my hands on, regardless of the sport.
Michael: Why did you enter last year’s Big Data Bowl?
Dani: I was excited to work with the NFL’s tracking data. I found the question that was asked technically challenging and important for football teams to understand. I thought it would be a great way to challenge us and demonstrate our skills.
James: The opportunity to work with data more detailed than typical play-by-play data I was used to was too good to pass up.
Matt: Tracking data offered a new and exciting field of study for me. I had the chance to view football in a way not many others had been able to and to possibly unearth insights for the first time. I felt myself to be on the cutting edge of analytics and found that to be one of the big drivers of joining this competition.

Lucas: Player tracking data provides us a great opportunity to analyze sports in a way more granular fashion. We’re able to answer a lot of interesting questions and to extract meaningful insights from the tracking data. This is a great venue for us to bring our analytics/data-science skills into sports and showcase the potential of sports analytics.
Michael: Give us your one paragraph elevator pitch – what was your entry about?
Dani: Our project could be broken down into three sections: Route Identification, Route Combination Evaluation and Quantification of Openness/Field Control. Route Identification is useful for a variety of reasons, including tagging game film, building novel receiver metrics and for evaluating route combinations. Route Combination Evaluation could be used to help inform new plays or determine the efficiency of current plays. Finally, the quantification of field control can be used to help evaluate both the design and execution of both running and passing plays.
Michael: What is one memory of the event that stands out as you look back?
Dani: It’s hard to choose one. The dinner the night before with the other finalists was a great way to get to know everyone. The walkthrough of the presentation rooms beforehand was great. To see our names on the banner was surreal. Seeing the crowd and knowing most of the NFL teams were represented was awesome. Finally, walking by [Dallas Cowboys head coach] Jason Garrett in the hallway was very cool.
Learn more about the 2019 Big Data Bowl
James: Standing in the presentation room looking around at all of these amazing people who we were competing with was surreal. Everyone's work was so inspired. There are so many good ideas and avenues to explore this data that I had never thought of until I got there.
Matt: If I had to focus on one standout feature, it would have to be the meet-and-greet poster conference after the presentations. Being from a smaller school and Canadian, I rarely have the chance to talk with NFL representatives and affiliates about the inner workings of the game. What I learned from my conversations in that brief hour-long session has fueled many new research questions going forward.
Lucas: It was awesome to be selected as one of the finalists and fly to Indianapolis to present our ideas to NFL personnel. The conversation and the feedback we got from them were valuable for us to develop our ideas further down the road.
Recap of the 2019 Big Data Bowl
Michael: NextGenStats can be tricky. What would your recommendation be for a first-timer dealing with NFL player tracking data?
Dani: My recommendations would be to:
- Start small. Build out your work for one play. Write a function for that one thing and then generalize it to all plays.
- Get rid of unnecessary data as soon as possible. Drop columns you aren’t using and rows you don’t need.
- Build small functions to do useful things and give yourself a toolbox/package of functions to work with.
James: Make a function for every different data transformation you do. Keep them very general so that no matter where you are with your code it will work. It’s a complicated data set, but it’s simple to manage with smaller steps.
Matt: Visualize frequently. We had sample code for creating GIFs of plays that proved invaluable. When we were working, we chose a few plays that we could also find on YouTube and built our intuition about the data and its real-life counterpart. Tracking data is nearly uninterpretable in table formats — I feel it needs to be seen to be understood.
Lucas: Start with the most intuitive things. For instance, visualize the movement of players and ball, then move on to distance travelled, speed and acceleration, etc. It’s also a good idea to do pair-programming, where you always have someone looking after you.
Michael: Tell us a bit about your summer job working with the NFL.
Dani: Working for the NFL this summer was unreal. We got to work on technically challenging material and are helping inform change in the NFL. It is great to see an investment from the league in data-driven changes.
James: I never thought that I would find myself working for the NFL, let alone while I was still a student. It was great to talk about how our work could be used to help make decisions based on player movement in the NFL.
Matt: The NFL gave us a wonderful opportunity to expand our ideas even further after the Big Data Bowl this summer through a project with them. We had the opportunity to explore more positions than just eligible receivers, describing movement patterns across the game. Our work felt important to the game and the NFL, truly putting us at the cutting edge of analytics. I have nothing but positives to say of this wonderful experience.
Lucas: It’s incredible to see our Big Data Bowl submission leading to our opportunity working with the NFL. We are able to explore the movement patterns of different positions. It’s truly exciting to further develop our statistical methods, learn how to leverage cloud computing and deliver our analytics results to the NFL.
Where Your Favorite Team Likes to Pass the Ball
September 23, 2019
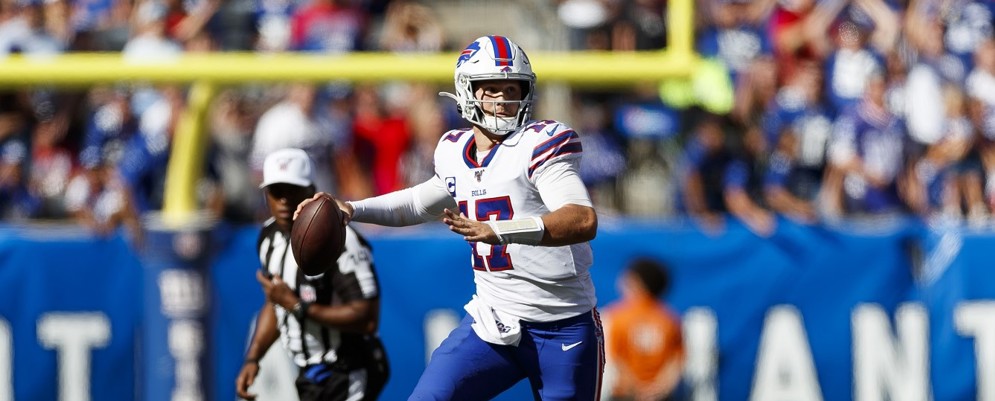
When an NFL quarterback drops back to pass, where is he likely to throw the football?
For decades, scouts would scour film looking for insight into answering this question. Left-handed quarterbacks would presumably favor the left side of the field, whereas other passers were seen as preferring the deep ball. Most recently, Carolina Panthers quarterback Cam Newton came under questioning for not throwing downfield at all.
With the advancement of NFL Next Gen Stats, which tracks every player – on every play, anywhere on the field – at a rate of roughly ten frames per second, scouts are no longer the only football personnel who can measure pass locations.
The following two charts use Next Gen Stats data to compare each team’s passing locations from the 2018 season to the overall league average. For technical followers, two-dimensional kernal density estimation was used to smooth the data.
First, here is each AFC team. In the top left, we see that the Buffalo Bills’ chart features several deep throws, perhaps not surprising given that Buffalo quarterback Josh Allen can chuck it 75 yards. Alternatively, the Oakland Raiders and their quarterback Derek Carr tended to focus on shorter throws near the sideline (see bottom right).
WHERE AFC TEAMS THROW
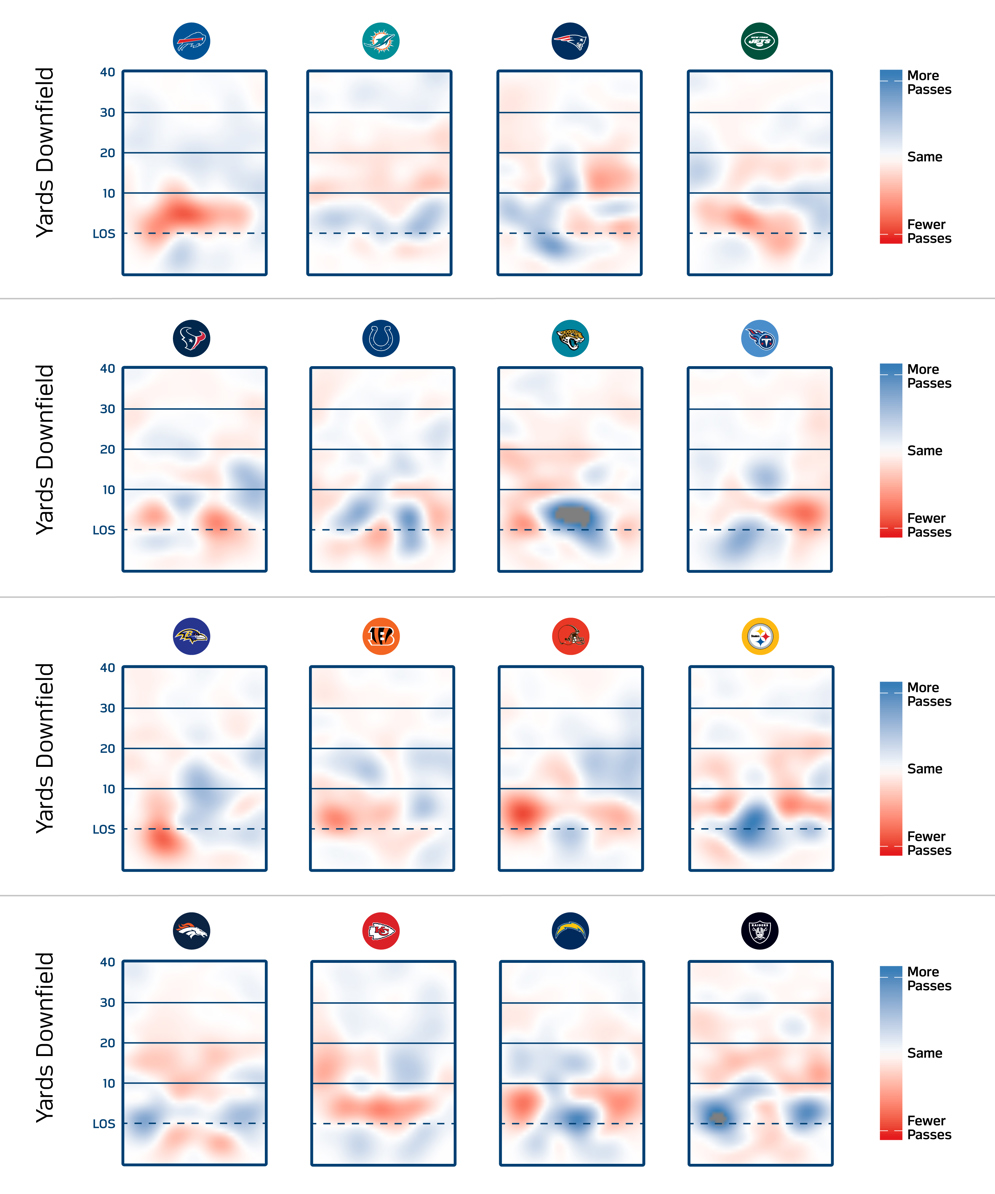
Next, here is each NFC team.
In the bottom right of the below graphic, the Seattle Seahawks, led by Russell Wilson, stand out as a team that, instead of throwing deep or short, tended to mostly throw to the left side of the field. Alternatively, in the top-right, the Tampa Bay Buccaneers, with both Jameis Winston and Ryan Fitzpatrick behind center, featured a greater rate of intermediate throws (5-20 yards) than any other team in the league.
WHERE NFC TEAMS THROW
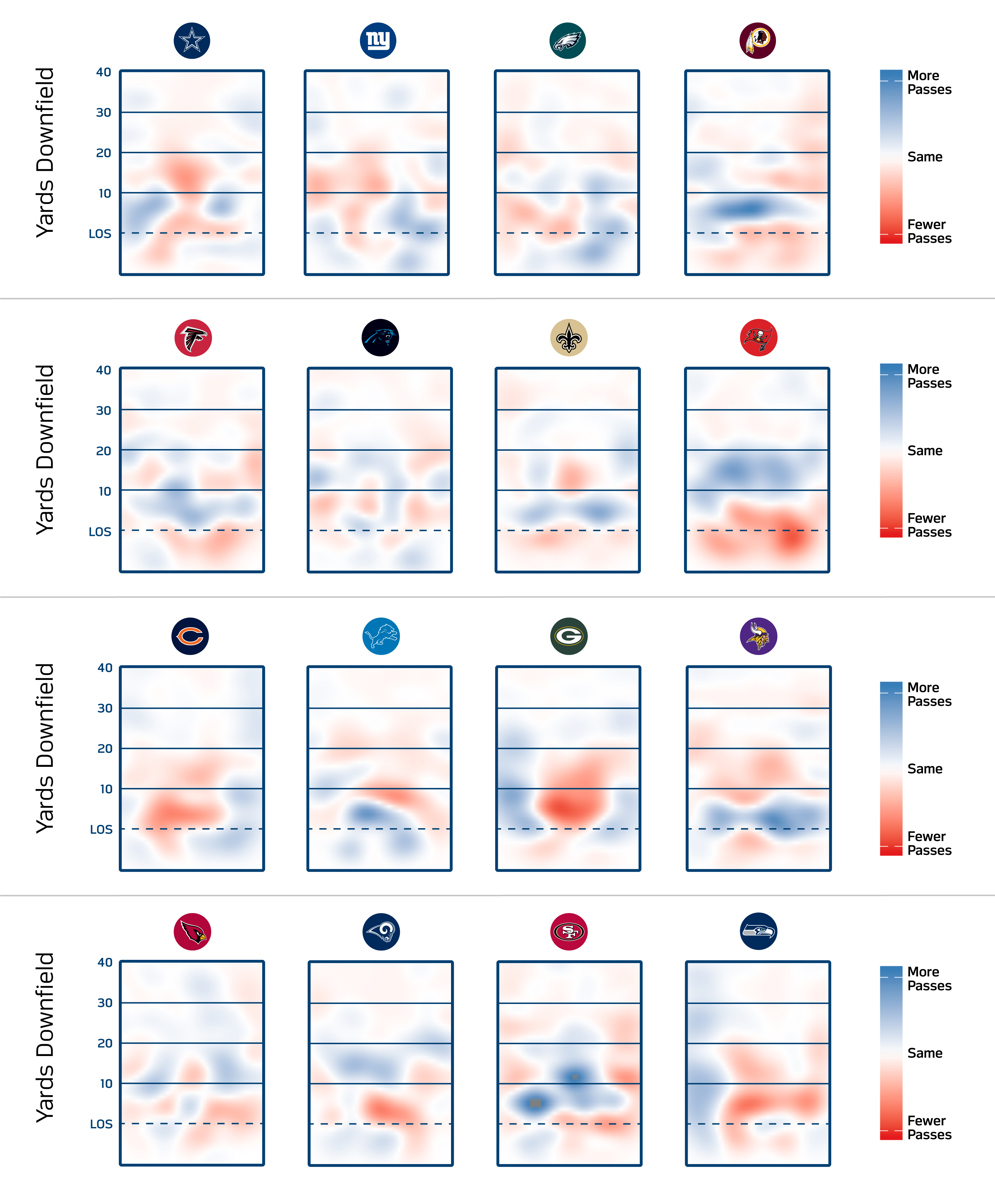
While pass location for each team is one interesting way of using player tracking data, the league also uses it to inform other aspects of the game, including rule changes and the position of officials. For now, as your favorite team steps back to pass, know that wherever the ball lands, the NFL is tracking it.
Using Data and Analytics to Identify High-Impact Fouls
September 23, 2019
As the NFL began its offseason, several club rules proposals sought to expand the use of replay to include penalties. In response, the NFL Competition Committee used data and analytics to identify fouls that have the biggest impact on game outcomes.
To assess impact, the committee used win probability, also known as game winning chance. Below is one example. The black line (New Orleans Saints) and gold line (Pittsburgh Steelers) in the animation show the game winning chance for both teams at each point in the game during their 2018 Week 16 matchup.
The game was back-and-forth. New Orleans led at halftime, only to see Pittsburgh regain the lead late in the third quarter. With 1:25 remaining in the game, a Michael Thomas touchdown reception led New Orleans to a 31-28 win. Amidst all this action, two of the seven most impactful plays — as judged by the change in game winning chance from one play to the next — were defensive pass interference calls.
First, at the end of the first quarter, this call on Pittsburgh’s Joe Haden increased New Orleans’ game winning chance by 14 percent, from 43 to 57 percent.
Then, with two minutes left, this defensive pass interference foul by Haden on Thomas increased New Orleans’ win chances by 21 percent.
In reviewing game winning chance data across several seasons, the committee found that both defensive and offensive pass interference tended to have disproportionately large impacts on changes to each team’s game winning chance.
Armed with this and other information, the Competition Committee prioritized these two fouls as it looked to expand replay to include penalties. Under the new rules, both calls on Haden would be reviewable, as would potential offensive and defensive pass interference calls that were not made on the field.
NFL Football Operations’ mission is to establish a culture of clarity, consistency and credibility in all aspects of the greatest game. Football is an essential piece of America’s fabric, uniting fans, players and communities with a simple yet powerful bond. We honor the game’s history while continuing to innovate and preserve the sport for future generations of fans, players, coaches, teams and officials.
© 2024 National Football League. All rights reserved.