The Extra Point Where Do Ball Carriers Tend to Move?
October 15, 2019
Where do ball carriers tend to move?
The primary theme of the NFL’s second Big Data Bowl, a competition that crowdsources analytical insight into football data, is to predict performance on rush plays. From the moment a ball carrier takes a handoff, where will he end up?
As part of the contest, participants receive snapshots of Next Gen Stats player tracking data from every 2017 and 2018 handoff play. This data includes the speed, angle and direction in which each of the 22 players on the field were moving. One potential input for competitors to consider using in their predictions is the angle in which the ball carrier was moving when he got the ball. As an example, players moving towards the sideline may simultaneously be more likely to be stuffed for a loss and to pick up big yardage (if, for example, he were to outrun defenders).
One cool plot that can be made from the data (see the statistical code for yourself) is a sonar chart. Initially popularized in soccer by Eliot McKinley, sonars allow us to identify the angles that players tend to move. With ball carriers, the size of each sonar band corresponds to the frequency with which ball carriers are moving in each binned direction group, and the color reflects how successful they are with the ball. Success rate is determined by down and distance (e.g., a three-yard run play on first-and-10 is not a success, while it is a success on third-and-two).
Here’s a sonar for each player who led his team in carries during the 2017 and 2018 regular seasons. Bands are pointing up, corresponding to players moving from the bottom of the screen to the top, and consist of data from each the past two seasons.
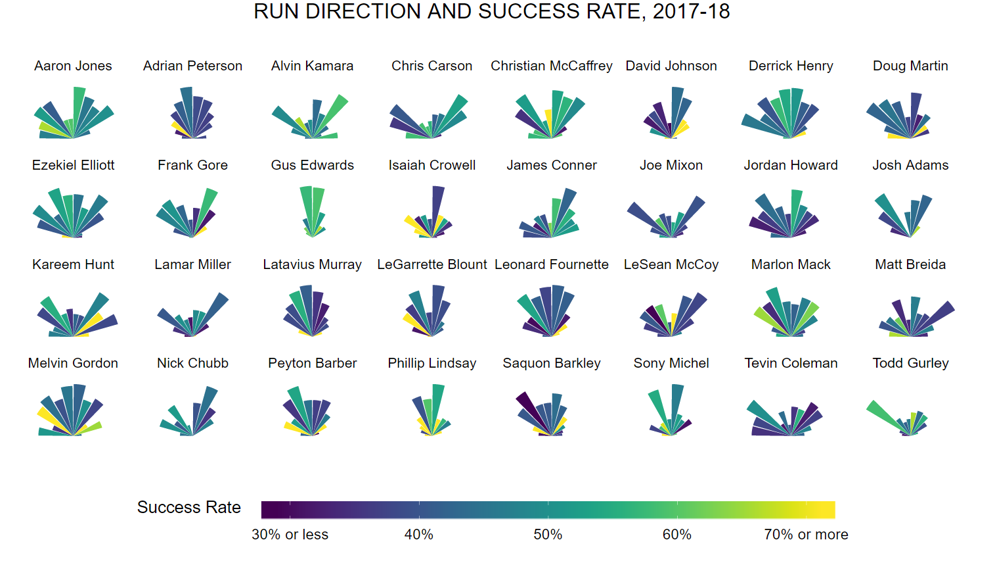
Compare the sonars of Gus Edwards (Baltimore Ravens) and Alvin Kamara (New Orleans Saints). Both boast success rates around 60%, but Edwards did most of his damage up the middle, while Kamara tended to get the ball off-tackle. Alternatively, as you’ll see near the bottom right of the chart, then-Atlanta Falcons running back Tevin Coleman (outside runs) and New England Patriots back Sony Michel (up the middle) also offer a nice contrast.
Information provided in sonars is just one of the many features available for Big Data Bowl contestants to use as they develop their algorithms. Stay tuned for the end of the 2019 regular season, where a live leaderboard will help determine the most accurate predictor of ball carrier success — and the Big Data Bowl title that comes with it.
NFL Football Operations’ mission is to establish a culture of clarity, consistency and credibility in all aspects of the greatest game. Football is an essential piece of America’s fabric, uniting fans, players and communities with a simple yet powerful bond. We honor the game’s history while continuing to innovate and preserve the sport for future generations of fans, players, coaches, teams and officials.
© 2026 National Football League. All rights reserved.