The Extra Point How Player Performance and Team Efficiency Are Affected by Each Tick on the Play Clock
January 3, 2024
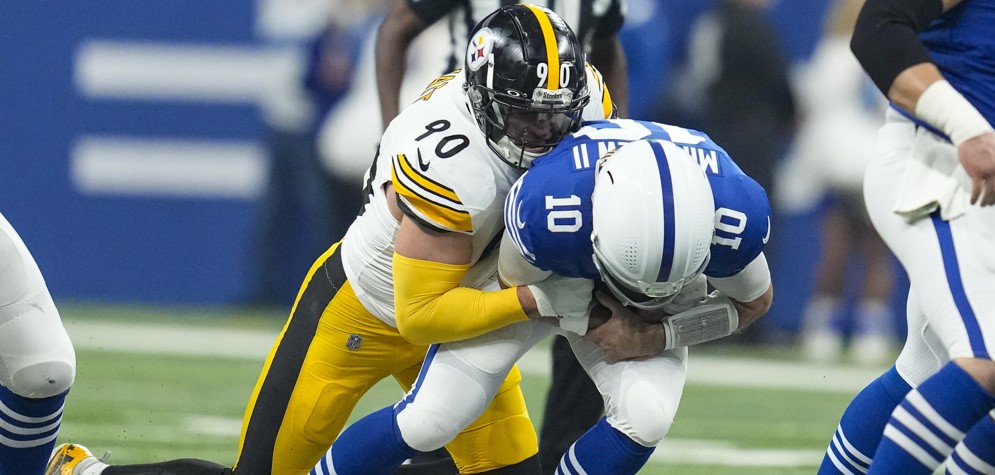
During the NFL’s Week 15 game between the Pittsburgh Steelers and Indianapolis Colts, Steelers linebacker T.J. Watt timed his pass rush perfectly to sack Colts QB Gardner Minshew.
In the clip below, Watt is nearly across the line of scrimmage before anyone else has moved.
One potential reason for Watt’s anticipation? The play clock, which ticked down to only one second at the time of the snap. With such little time left, Watt seemed to time the snap and gain an edge on the Colts’ offensive line.
This skill is not unique to Watt – using Next Gen Stats tracking data, defensive ends typically reach speeds that are 10% faster with one second left (16 MPH) on the play clock, relative to 10 seconds left (14 MPH).
More importantly, that impact of the play clock extends to the entire offensive side of the ball.
The graph below shows the expected points added (EPA) per play from 2016-23 by quarter, play type (run or pass), and time remaining on the play clock. The size of the dots represents the relative sample size for a given play clock snap time.

In the first quarter, there is a dramatic drop in EPA as the play clock ticks for passing plays – roughly a 0.015 EPA per play decrease for each second on the play clock. This trend represents an overall delta of approximately 0.2 EPA per play from 15 seconds on the play clock to one second. For reference, a difference of 0.2 EPA per play is similar to the difference between the second-highest EPA per pass team of 2023 (Dallas Cowboys) and the 19th-highest EPA per pass team of the 2023 season (Indianapolis Colts).
A drop in offensive efficiency also exists in the second (-0.009 EPA per play clock second) and third quarters (-0.008 EPA per play clock second). By the fourth quarter, however, when play clock snap time typically ties to score and time remaining, the relationship is not as strong (-0.004 EPA per play clock second).
There is no noticeable link between running play performance and play clock time.
Outside of the ability of defensive players to anticipate snap counts late in the play clock, there are a few other explanations for the drop in offensive performance. For example, quarterbacks less prepared to face specific defensive looks may take longer on the play clock as they change their protection or play call. In the first quarter, offenses typically “script” plays – anything off script may result in more time on the play clock and worsen performance.
This decline in performance appears to exist for most teams. Since 2016, for 71% of team seasons (182 of 256), the average EPA on passes were lower on plays snapped with five or less seconds on the play clock, relative to those snapped with 10 or more seconds. This season, the Seattle Seahawks have a 0.06 EPA per play when the ball is snapped with 10 or more seconds, but -0.39 EPA per play when the ball is snapped with five or less seconds.
NFL Football Operations’ mission is to establish a culture of clarity, consistency and credibility in all aspects of the greatest game. Football is an essential piece of America’s fabric, uniting fans, players and communities with a simple yet powerful bond. We honor the game’s history while continuing to innovate and preserve the sport for future generations of fans, players, coaches, teams and officials.
© 2026 National Football League. All rights reserved.