The Extra Point Q&A with 2019 Big Data Bowl College Winners
September 25, 2019
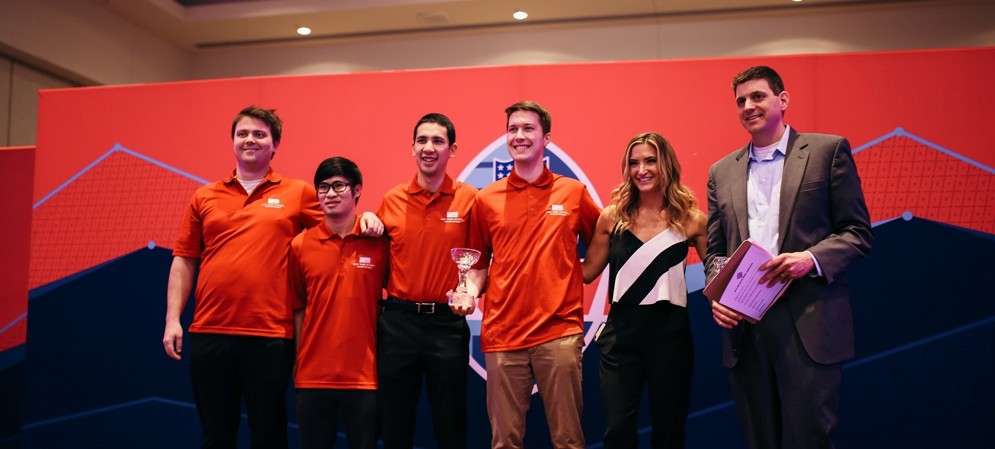
The first-ever Big Data Bowl brought together talented members of the analytics community – from college students to professionals – to crowdsource innovative and data-driven football ideas. For today’s Extra Point, we interviewed the college entry winners from Simon Fraser University – Matthew Reyers, Dani Chu, Lucas Wu and James Thomson – to hear more about their experiences and findings. The group’s first-place report, Routes to Success, modeled play success rate and expected points under various passing combinations.
Michael Lopez (Director of Football Data and Analytics, NFL): Tell us a bit about your background in analytics and football.
James: I’ve played football since high school, first as a defensive tackle and back, later in rec league flag football in college. It’s been my favorite game to play since I was 14. I got interested in sports statistics during my undergraduate degree in statistics, when I started following baseball more closely. I quickly turned to football, and since the beginning of my master’s in statistics, I have been active in football statistical research.
Dani: I’ve played sports my whole life, but my introduction to football was mainly through fantasy football. While I have played football in a casual setting, I have not played in an organized environment. I started statistical research in sports in 2016. I have a background in math, computer science and statistics.
Related: Read the group's winning report - Routes to Success
Matt: In elementary school, I thought I was going to be the next NFL star. It took all of five games to realize that wasn’t the case. I played for a few more games after that but stuck with other sports. When I eventually got to University, I stumbled across statistics and a group of people that liked sports as much as I did. Since that class four years ago, I have been applying statistics to as many sports problems as I can get my hands on, regardless of the sport.
Michael: Why did you enter last year’s Big Data Bowl?
Dani: I was excited to work with the NFL’s tracking data. I found the question that was asked technically challenging and important for football teams to understand. I thought it would be a great way to challenge us and demonstrate our skills.
James: The opportunity to work with data more detailed than typical play-by-play data I was used to was too good to pass up.
Matt: Tracking data offered a new and exciting field of study for me. I had the chance to view football in a way not many others had been able to and to possibly unearth insights for the first time. I felt myself to be on the cutting edge of analytics and found that to be one of the big drivers of joining this competition.
Lucas: Player tracking data provides us a great opportunity to analyze sports in a way more granular fashion. We’re able to answer a lot of interesting questions and to extract meaningful insights from the tracking data. This is a great venue for us to bring our analytics/data-science skills into sports and showcase the potential of sports analytics.
Michael: Give us your one paragraph elevator pitch – what was your entry about?
Dani: Our project could be broken down into three sections: Route Identification, Route Combination Evaluation and Quantification of Openness/Field Control. Route Identification is useful for a variety of reasons, including tagging game film, building novel receiver metrics and for evaluating route combinations. Route Combination Evaluation could be used to help inform new plays or determine the efficiency of current plays. Finally, the quantification of field control can be used to help evaluate both the design and execution of both running and passing plays.
Michael: What is one memory of the event that stands out as you look back?
Dani: It’s hard to choose one. The dinner the night before with the other finalists was a great way to get to know everyone. The walkthrough of the presentation rooms beforehand was great. To see our names on the banner was surreal. Seeing the crowd and knowing most of the NFL teams were represented was awesome. Finally, walking by [Dallas Cowboys head coach] Jason Garrett in the hallway was very cool.
Learn more about the 2019 Big Data Bowl
James: Standing in the presentation room looking around at all of these amazing people who we were competing with was surreal. Everyone's work was so inspired. There are so many good ideas and avenues to explore this data that I had never thought of until I got there.
Matt: If I had to focus on one standout feature, it would have to be the meet-and-greet poster conference after the presentations. Being from a smaller school and Canadian, I rarely have the chance to talk with NFL representatives and affiliates about the inner workings of the game. What I learned from my conversations in that brief hour-long session has fueled many new research questions going forward.
Lucas: It was awesome to be selected as one of the finalists and fly to Indianapolis to present our ideas to NFL personnel. The conversation and the feedback we got from them were valuable for us to develop our ideas further down the road.
Recap of the 2019 Big Data Bowl
Michael: NextGenStats can be tricky. What would your recommendation be for a first-timer dealing with NFL player tracking data?
Dani: My recommendations would be to:
James: Make a function for every different data transformation you do. Keep them very general so that no matter where you are with your code it will work. It’s a complicated data set, but it’s simple to manage with smaller steps.
Matt: Visualize frequently. We had sample code for creating GIFs of plays that proved invaluable. When we were working, we chose a few plays that we could also find on YouTube and built our intuition about the data and its real-life counterpart. Tracking data is nearly uninterpretable in table formats — I feel it needs to be seen to be understood.
Lucas: Start with the most intuitive things. For instance, visualize the movement of players and ball, then move on to distance travelled, speed and acceleration, etc. It’s also a good idea to do pair-programming, where you always have someone looking after you.
Michael: Tell us a bit about your summer job working with the NFL.
Dani: Working for the NFL this summer was unreal. We got to work on technically challenging material and are helping inform change in the NFL. It is great to see an investment from the league in data-driven changes.
James: I never thought that I would find myself working for the NFL, let alone while I was still a student. It was great to talk about how our work could be used to help make decisions based on player movement in the NFL.
Matt: The NFL gave us a wonderful opportunity to expand our ideas even further after the Big Data Bowl this summer through a project with them. We had the opportunity to explore more positions than just eligible receivers, describing movement patterns across the game. Our work felt important to the game and the NFL, truly putting us at the cutting edge of analytics. I have nothing but positives to say of this wonderful experience.
Lucas: It’s incredible to see our Big Data Bowl submission leading to our opportunity working with the NFL. We are able to explore the movement patterns of different positions. It’s truly exciting to further develop our statistical methods, learn how to leverage cloud computing and deliver our analytics results to the NFL.
NFL Football Operations’ mission is to establish a culture of clarity, consistency and credibility in all aspects of the greatest game. Football is an essential piece of America’s fabric, uniting fans, players and communities with a simple yet powerful bond. We honor the game’s history while continuing to innovate and preserve the sport for future generations of fans, players, coaches, teams and officials.
© 2026 National Football League. All rights reserved.