Back to Updates
NFL Announces 2017 Performance-Based Pay Distributions
NFL Players will receive $134.16 million in “Performance-Based Pay” for their performance during the 2017 season. The Performance-Based Pay program is a collectively bargained benefit that compensates all players, including rookies, based upon their playing time and salary levels.
In addition to the Performance-Based Pay pool, the NFL Players Association has elected to dedicate $35.2 million in benefits ($1.1 million per club) to fund the “Veteran Pool,” a Veteran Performance-Based Compensation Pool for players with more than one accrued season. In total, $169.36 million will be disbursed to players under the combined pools.
Tennessee Titans guard Quinton Spain earned the highest amount of all NFL players in the Performance-Based Pay program and the Veteran Pool. Under the combined pools, Spain will receive $489,782.
A 2015 undrafted free agent out of West Virginia, Spain played in 14 games for the Titans this season, starting all games in which he played. He played in 85.71 percent of Tennessee’s offensive plays and 13.08 percent of the Titans’ special teams plays, while earning the league minimum salary for a player with two credited seasons.
Players have been paid nearly $1.4 billion cumulatively since the inception of the Performance-Based Pay program, which was implemented as part of the NFL’s 2002 CBA with the NFLPA, and is part of the current agreement.
The Veteran Pool is a component of the Rookie Redistribution Fund, a player benefit that was created under the 2011 CBA. The NFLPA elected to fund the Veteran Pool for the first time in 2016 and extended the benefit for the 2017 season.
How Performance-Based Pay Works
Under the Performance-Based Pay program, a fund is created and used as a supplemental form of compensation based on a comparison of playing time to salary. Players are eligible to receive a bonus distribution in any regular season in which they play at least one official down. In general, players with higher playtime percentages and lower salaries benefit most from the pools.
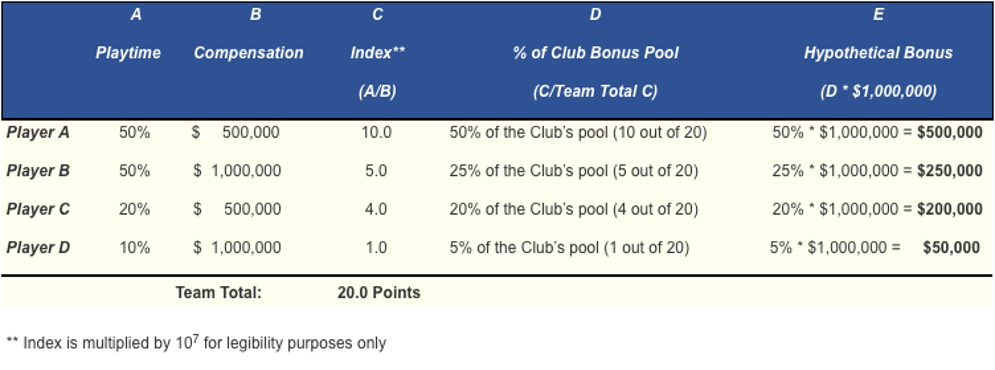
Performance-Based Pay is computed by using a player index in which a player’s regular-season playtime (total plays on offense, defense and special teams) is divided by his adjusted regular-season compensation (full season salary, prorated portion of signing bonus, earned incentives). Each player’s index is compared to those of the other players on his team to determine the amount of his Performance-Based Pay.
The Veteran Pool is computed in a similar manner, with two significant modifications: 1) players with zero accrued seasons are not eligible to receive distributions, though such players remain eligible to receive distributions under the Performance-Based Pay program; and 2) to calculate the eligible player’s index, if the player’s full-season base salary is less than $1 million, an additional amount will be imputed so that the player’s base salary equals $1 million. By imputing a minimum of $1 million to the denominator of the Veteran Pool’s index calculation (playtime divided by salary), a slightly higher percentage of the pool is directed to high-performing veteran players whose salaries exceed $1 million but are not among the highest in the league, as contemplated by the formula. This imputation of salary is solely for calculating distributions from the pool, and does not affect the actual salary paid to the player under his contract.
Illustration of Performance-Based Pay System
Each player on the same team competes for his share of his club’s Performance-Based Pay pool. The hypothetical example in the table below illustrates how the Player Index works, using a simplified four-player team and a club bonus pool of $1,000,000. Each player receives his share of the pool depending on how his index compares to those of his teammates.
| TOP 25 PERFORMANCE-BASED PAY DISTRIBUTIONS FOR 2017 | ||||||
| Player | Team | Pos. | College | Rookie Yr | Draft Rd | Distribution |
| Quinton Spain | Tennessee | G | West Virginia | 2015 | UDFA | $385,490.95 |
| Wes Schweitzer | Atlanta | G | San Jose State | 2016 | 6 | $376,698.80 |
| Jalen Mills | Philadelphia | CB | LSU | 2016 | 7 | $364,744.97 |
| Anthony Brown | Dallas | CB | Purdue | 2016 | 6 | $345,299.22 |
| Keelan Cole | Jacksonville | WR | Kentucky Wesleyan | 2017 | UDFA | $344,998.87 |
| Nicholas Morrow | Oakland | LB | Greenville | 2017 | UDFA | $337,312.82 |
| Eddie Jackson | Chicago | S | Alabama | 2017 | 4 | $334,782.65 |
| John Wetzel | Arizona | T | Boston College | 2013 | UDFA | $333,603.68 |
| Kevin Byard | Tennessee | S | Middle Tennessee | 2016 | 3 | $333,066.93 |
| Mike Hilton | Pittsburgh | CB | Mississippi | 2016 | UDFA | $327,377.67 |
| Daryl Williams | Carolina | T | Oklahoma | 2015 | 4 | $321,834.89 |
| Jayon Brown | Tennessee | LB | UCLA | 2017 | 5 | $321,425.69 |
| Trevor Williams | LA Chargers | CB | Penn State | 2016 | UDFA | $316,820.42 |
| Shaq Mason | New England | G | Georgia Tech | 2015 | 4 | $314,837.80 |
| Ricardo Allen | Atlanta | S | Purdue | 2014 | 5 | $313,711.25 |
| Dak Prescott | Dallas | QB | Mississippi State | 2016 | 4 | $313,406.43 |
| Trey Hopkins | Cincinnati | G | Texas | 2014 | UDFA | $310,435.00 |
| Jesse Davis | Miami | G/T | Idaho | 2015 | UDFA | $308,989.36 |
| Spencer Pulley | LA Chargers | C | Vanderbilt | 2016 | UDFA | $304,021.36 |
| Tyler Larsen | Carolina | C | Utah State | 2014 | UDFA | $299,594.37 |
| Joe Thuney | New England | G | North Carolina State | 2016 | 3 | $296,620.57 |
| Ken Crawley | New Orleans | CB | Colorado | 2016 | UDFA | $295,826.77 |
| Jesse James | Pittsburgh | TE | Penn State | 2015 | 5 | $293,971.07 |
| Halapoulivaati Vaitai | Philadelphia | T | TCU | 2016 | 5 | $293,132.51 |
| Blake Martinez | Green Bay | LB | Stanford | 2016 | 4 | $291,170.83 |
| TOP 25 BONUSES IN VETERAN PERFORMANCE-BASED COMPENSATION | ||||||
| Player | Team | Pos. | College | Rookie Yr | Draft Rd | Distribution |
| Quinton Spain | Tennessee | G | West Virginia | 2015 | UDFA | $ 104,291.40 |
| Kevin Byard | Tennessee | S | Middle Tennessee | 2016 | 3 | $ 100,588.09 |
| Blake Martinez | Green Bay | LB | Stanford | 2016 | 4 | $ 93,219.71 |
| Jalen Mills | Philadelphia | CB | LSU | 2016 | 7 | $ 92,695.20 |
| Anthony Brown | Dallas | CB | Purdue | 2016 | 6 | $ 92,391.27 |
| Dontae Johnson | San Francisco | CB | North Carolina State | 2014 | 4 | $ 91,021.05 |
| Graham Glasgow | Detroit | G | Michigan | 2016 | 3 | $ 89,630.21 |
| Wes Schweitzer | Atlanta | G | San Jose State | 2016 | 6 | $ 89,366.46 |
| Matthias Farley | Indianapolis | S | Notre Dame | 2016 | UDFA | $ 88,669.91 |
| A.J. Cann | Jacksonville | G | South Carolina | 2015 | 3 | $ 87,905.02 |
| Dak Prescott | Dallas | QB | Mississippi State | 2016 | 4 | $ 87,599.82 |
| Joe Schobert | Cleveland | LB | Wisconsin | 2016 | 4 | $ 87,456.29 |
| Trevor Williams | LA Chargers | CB | Penn State | 2016 | UDFA | $ 87,290.83 |
| Kenny Wiggins | LA Chargers | G | Fresno State | 2011 | UDFA | $ 87,217.41 |
| Jesse James | Pittsburgh | TE | Penn State | 2015 | 5 | $ 84,822.88 |
| Shaq Mason | New England | G | Georgia Tech | 2015 | 4 | $ 84,801.75 |
| Matt Paradis | Denver | C | Boise State | 2014 | 6 | $ 84,709.48 |
| Spencer Pulley | LA Chargers | C | Vanderbilt | 2016 | UDFA | $ 83,810.99 |
| Jacoby Brissett | Indianapolis | QB | North Carolina State | 2016 | 3 | $ 83,750.43 |
| Daryl Williams | Carolina | T | Oklahoma | 2015 | 4 | $ 83,592.18 |
| Brett Jones | NY Giants | C | Regina / Canada | 2015 | UDFA | $ 83,482.96 |
| Joe Haeg | Indianapolis | G/T | North Dakota State | 2016 | 5 | $ 82,977.72 |
| Ricardo Allen | Atlanta | S | Purdue | 2014 | 5 | $ 82,423.85 |
| Patrick Robinson | Philadelphia | CB | Florida State | 2010 | 1 | $ 82,299.68 |
| Jamon Brown | LA Rams | G | Louisville | 2015 | 3 | $ 81,340.80 |
| TOP 25 COMBINED TOTAL (PERFORMANCE-BASED PAY AND VETERAN PERFORMANCE-BASED COMPENSATION) | ||||||||
| Player | Team | Pos. | College | Rookie Yr. | Draft Rd. | Regular PBP | Veteran PBP | Combined Distribution |
| Quinton Spain | Tennessee | G | West Virginia | 2015 | UDFA | $385,490.95 | $104,291.40 | $489,782.35 |
| Wes Schweitzer | Atlanta | G | San Jose State | 2016 | 6 | $376,698.80 | $ 89,366.46 | $466,065.26 |
| Jalen Mills | Philadelphia | CB | LSU | 2016 | 7 | $364,744.97 | $ 92,695.20 | $457,440.17 |
| Anthony Brown | Dallas | CB | Purdue | 2016 | 6 | $345,299.22 | $ 92,391.27 | $437,690.49 |
| Kevin Byard | Tennessee | S | Middle Tennessee | 2016 | 3 | $333,066.93 | $100,588.09 | $433,655.02 |
| John Wetzel | Arizona | T | Boston College | 2013 | UDFA | $333,603.68 | $ 78,150.04 | $411,753.72 |
| Daryl Williams | Carolina | T | Oklahoma | 2015 | 4 | $321,834.89 | $ 83,592.18 | $405,427.07 |
| Trevor Williams | LA Chargers | CB | Penn State | 2016 | UDFA | $316,820.42 | $ 87,290.83 | $404,111.25 |
| Dak Prescott | Dallas | QB | Mississippi State | 2016 | 4 | $313,406.43 | $ 87,599.82 | $401,006.25 |
| Shaq Mason | New England | G | Georgia Tech | 2015 | 4 | $314,837.80 | $ 84,801.75 | $399,639.55 |
| Ricardo Allen | Atlanta | S | Purdue | 2014 | 5 | $313,711.25 | $ 82,423.85 | $396,135.10 |
| Trey Hopkins | Cincinnati | G | Texas | 2014 | UDFA | $310,435.00 | $ 78,705.77 | $389,140.77 |
| Spencer Pulley | LA Chargers | C | Vanderbilt | 2016 | UDFA | $304,021.36 | $ 83,810.99 | $387,832.35 |
| Blake Martinez | Green Bay | LB | Stanford | 2016 | 4 | $291,170.83 | $ 93,219.71 | $384,390.54 |
| Jesse James | Pittsburgh | TE | Penn State | 2015 | 5 | $293,971.07 | $ 84,822.88 | $378,793.95 |
| Ken Crawley | New Orleans | CB | Colorado | 2016 | UDFA | $295,826.77 | $ 78,770.57 | $374,597.34 |
| Graham Glasgow | Detroit | G | Michigan | 2016 | 3 | $284,719.38 | $ 89,630.21 | $374,349.59 |
| Joe Thuney | New England | G | North Carolina State | 2016 | 3 | $296,620.57 | $ 76,487.59 | $373,108.16 |
| Matt Paradis | Denver | C | Boise State | 2014 | 6 | $286,994.05 | $ 84,709.48 | $371,703.53 |
| Halapoulivaati Vaitai | Philadelphia | T | TCU | 2016 | 5 | $293,132.51 | $ 76,606.34 | $369,738.85 |
| Tyler Larsen | Carolina | C | Utah State | 2014 | UDFA | $299,594.37 | $ 63,648.92 | $363,243.29 |
| Matthias Farley | Indianapolis | S | Notre Dame | 2016 | UDFA | $269,426.45 | $ 88,669.91 | $358,096.36 |
| James Bradberry | Carolina | CB | Samford | 2016 | 2 | $279,160.17 | $ 74,637.30 | $353,797.47 |
| Will Parks | Denver | S | Arizona | 2016 | 6 | $275,592.65 | $ 72,994.20 | $348,586.85 |
| De'Vondre Campbell | Atlanta | LB | Minnesota | 2016 | 4 | $275,142.60 | $ 70,155.96 | $345,298.56 |
NFL Football Operations’ mission is to establish a culture of clarity, consistency and credibility in all aspects of the greatest game. Football is an essential piece of America’s fabric, uniting fans, players and communities with a simple yet powerful bond. We honor the game’s history while continuing to innovate and preserve the sport for future generations of fans, players, coaches, teams and officials.
© 2024 National Football League. All rights reserved.